Control Plane Monitoring & Alerts
This guide covers setting up monitoring and alerts for the truefoundry control plane.
Setup Monitoring
- Use tfy-grafana 0.1.11+
- Log in to Grafana and navigate to Dashboards
- Import the dashboards using the Grafana-hosted dashboard ID
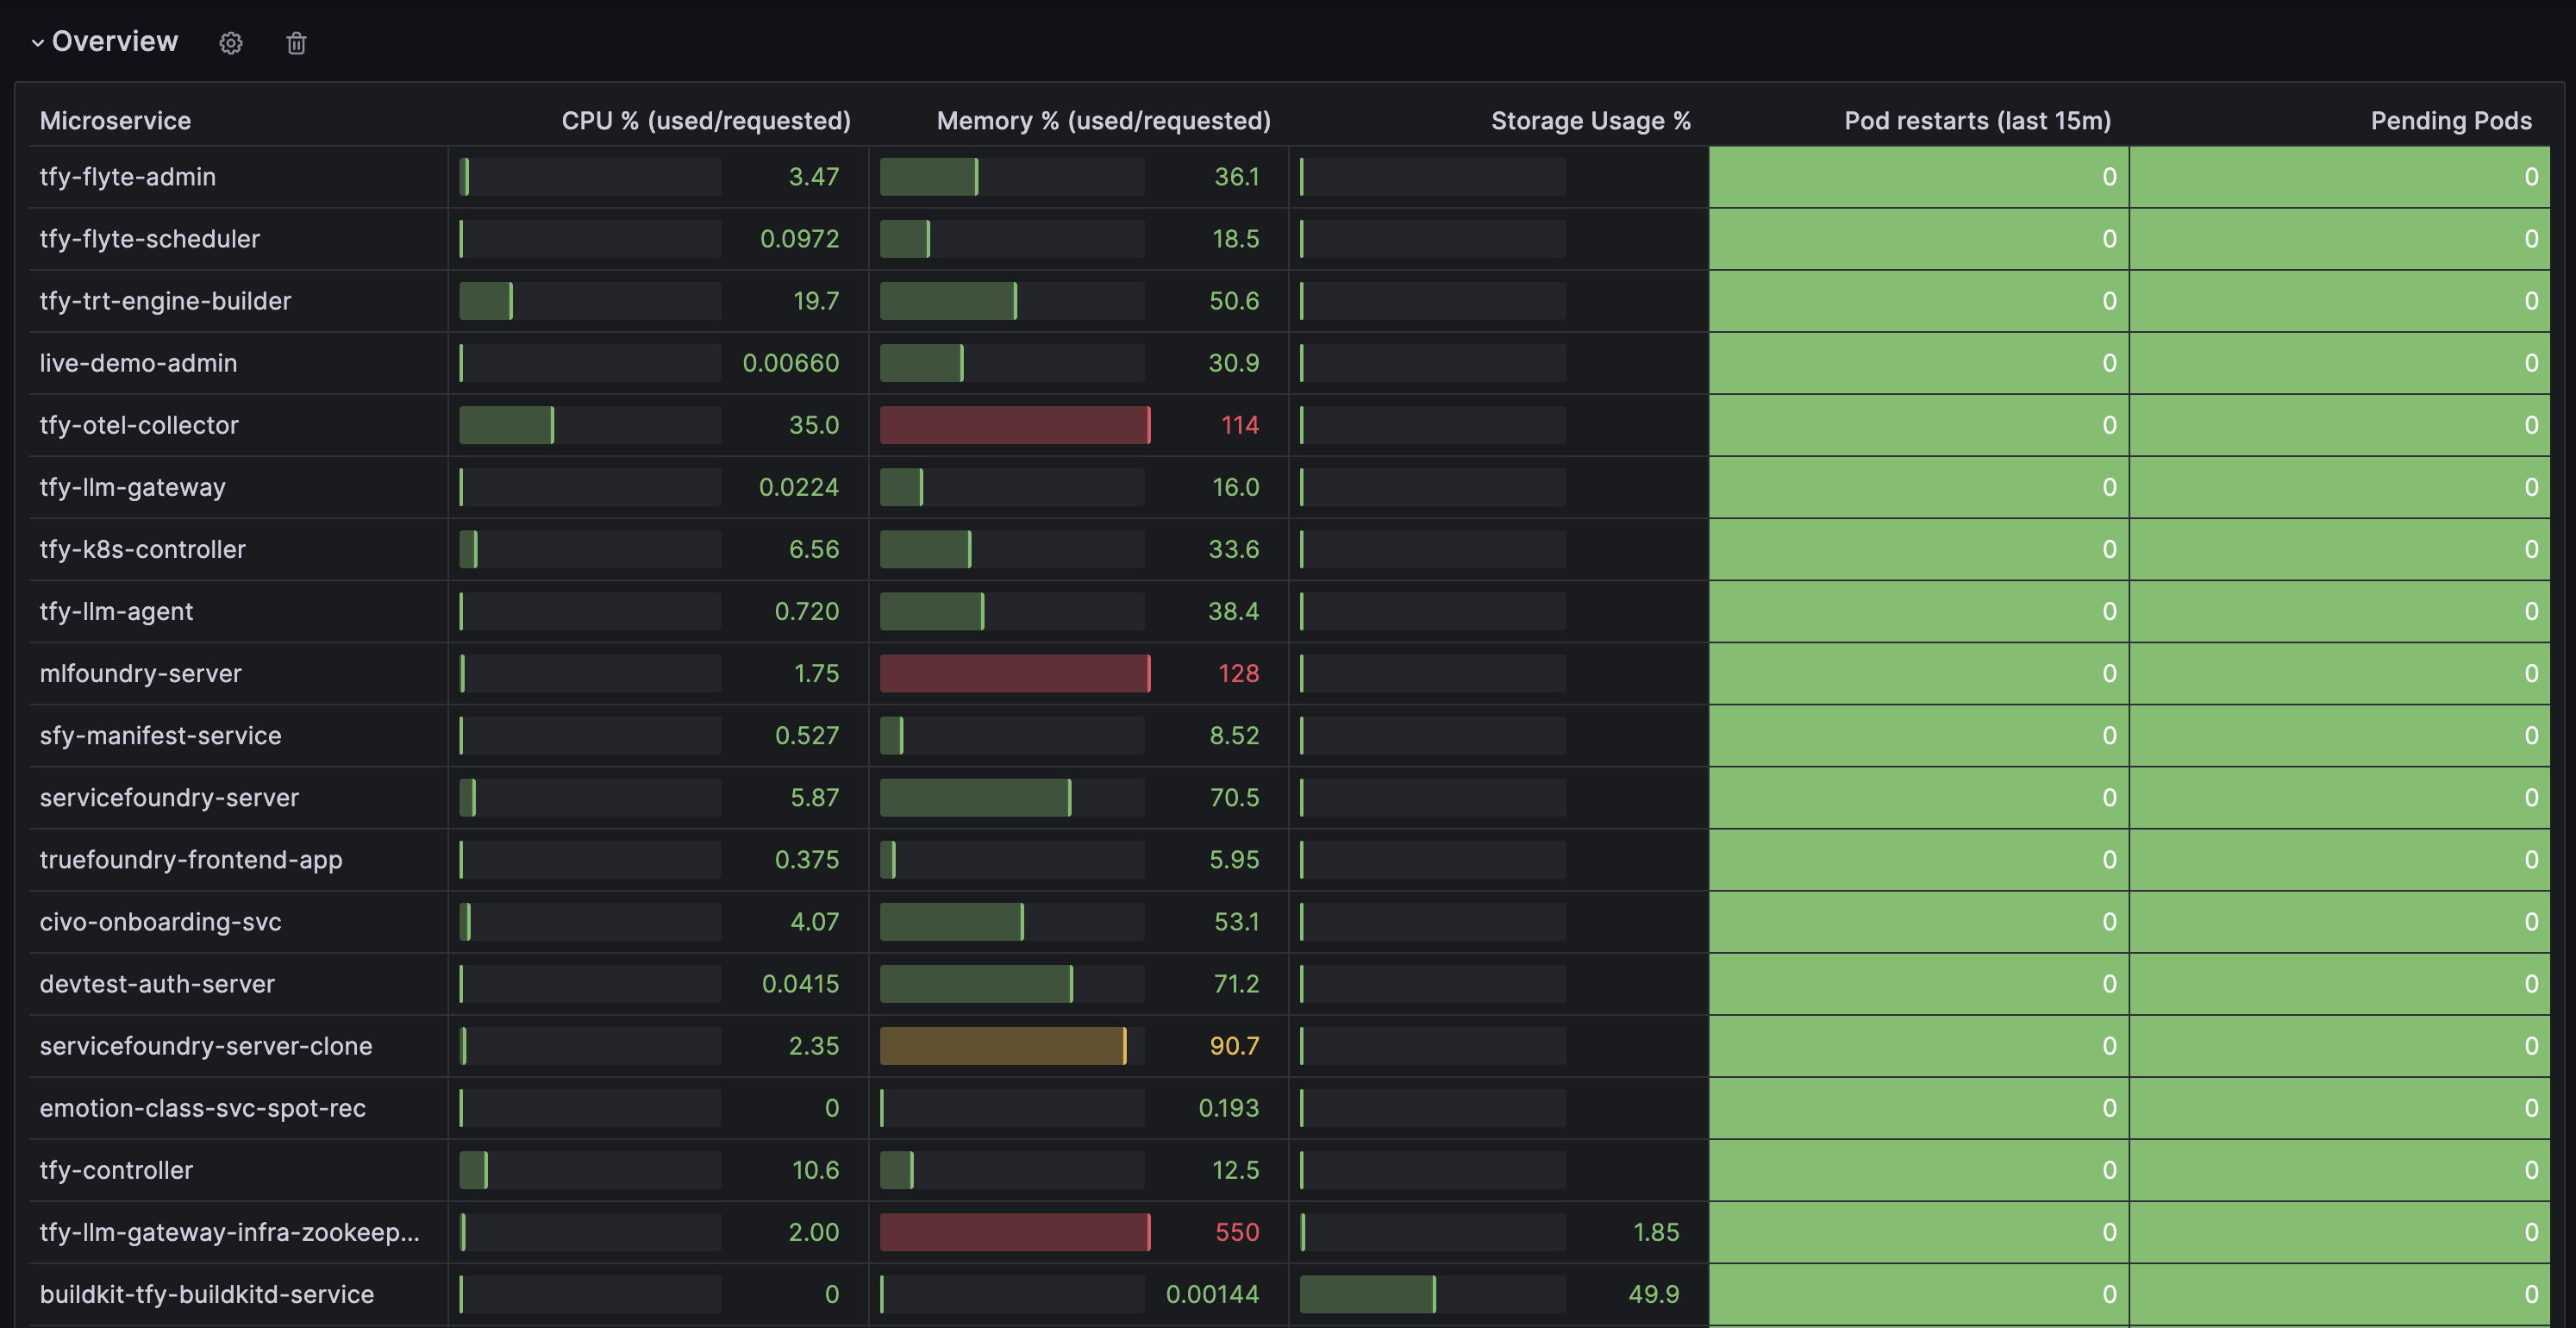
- Control Plane Infra monitoring - 23077
- LLM Gateway Request monitoring - 23351
- Monitor using TrueFoundry Control Plane and TrueFoundry LLM Gateway dashboards
Setup Alerts
- Use Prometheus version 0.69.6+ and tfy-prometheus-config 0.2.1+
- Enable
controlPlaneMonitorsintfy-prometheus-configand add the following section with your Slack webhook URLcontrolPlaneMonitors: alerts: alertManager: secret: data: API_URL: <WEBHOOK_URL> receivers: - name: tfy-control-plane-alerts-receiver slackConfigs: - apiURL: key: API_URL name: tfy-control-plane-alert-manager-secret channel: '#alerts' iconEmoji: ':alert:' sendResolved: true text: >- {{ range .Alerts }} {{ if eq .Status "firing" }}:warning:{{ else }}:white_check_mark:{{ end }} *Alert:* {{ .Annotations.summary }} *Severity:* `{{ .Labels.severity }}` *Description:* {{ .Annotations.description }} *Details:* {{ range.Labels.SortedPairs }} • *{{ .Name }}:* `{{ .Value }}` {{ end }} {{ end }} title: >- {{ if eq .Status "firing" }} FIRING ({{ .Alerts.Firing | len }}){{ else }} RESOLVED ({{ .Alerts.Resolved | len }}){{ end }} Control Plane Alerts enabled: true tenantName: <TENANT_NAME> - This will enable alerts on control plane components.
Updated 1 day ago