Triggering the workflow
- Workflows can be triggered from UI, CLI and also via python SDK
Triggering from UI
Triggering via cli
- Make sure the truefoundry[Workflow] is installed and is set up or you can refer to this guide to set up the cli.
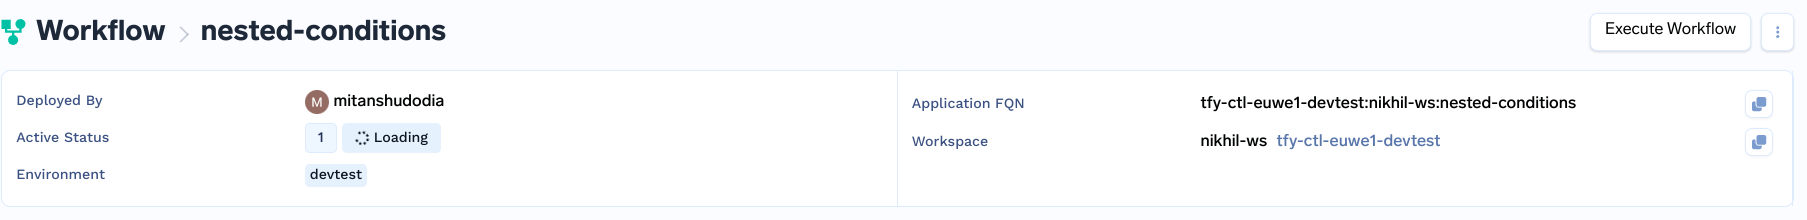
- Then copy the application fqn from the UI of the workflow
-
Then deploy using the following command
- if workflow accepts the input parameters you can pass them as arguments
Triggering via Python SDK
- Save the above file and run the following command
Checking workflow graph
- You can check the workflow graph by clicking on any of the workflow on workfow page and then clicking on graph page as shown in above tutorial
- The workflow execution graph shows the static graph of the workflow where each rectangle represents the tasks and the edges represent the execution order of each tasks, where a edge from one node to another node represent the connection from one task to another task.
Checking live execution graph of a workflow
- Graph of the workflow can be viewed on the execution page of that particular workflow.
- The rectangles represent the task and the edges represent the connection between nodes, so the edge from one task to another tells about the next task or step in the workflow after the current task is executed successfully.
- The yellow color around the task means that the task is running and if it turns red that means it is in a failed state and workflow has failed and if it is green in color then it is executed successfully.
- The dotted rectangle represents that the task is a conditional task and the highlighted border suggests which tasks were executed based on the condition defined in the workflow.
- If there are multiple nested conditional tasks then on clicking the task that was executed, then clicking on the conditional task will open another nested condition and now there will be two dotted rectangles around tasks as seen in above tutorial and this will keep on increasing until the task are executed successfully and there are no nested conditions left.
Checking Execution Logs, Metrics and Events
- You can check the logs, metrics, and events for each task individually by clicking on that particular task or node.
- For conditional task, you can check the metrics and logs of the task that were executed in the workflow.
- For map task, when you click on map task, a new page opens where you can see all the subtasks and each sub-task has its own logs metrics and events.