Analytics
The analytics dashboard offers an interactive interface for gaining insights into your LLM application. It displays a variety of graphs and metrics, including data on requests to different LLMs, costs, latencies, tokens, user activity, model usage, errors, requests affected by config, and more.
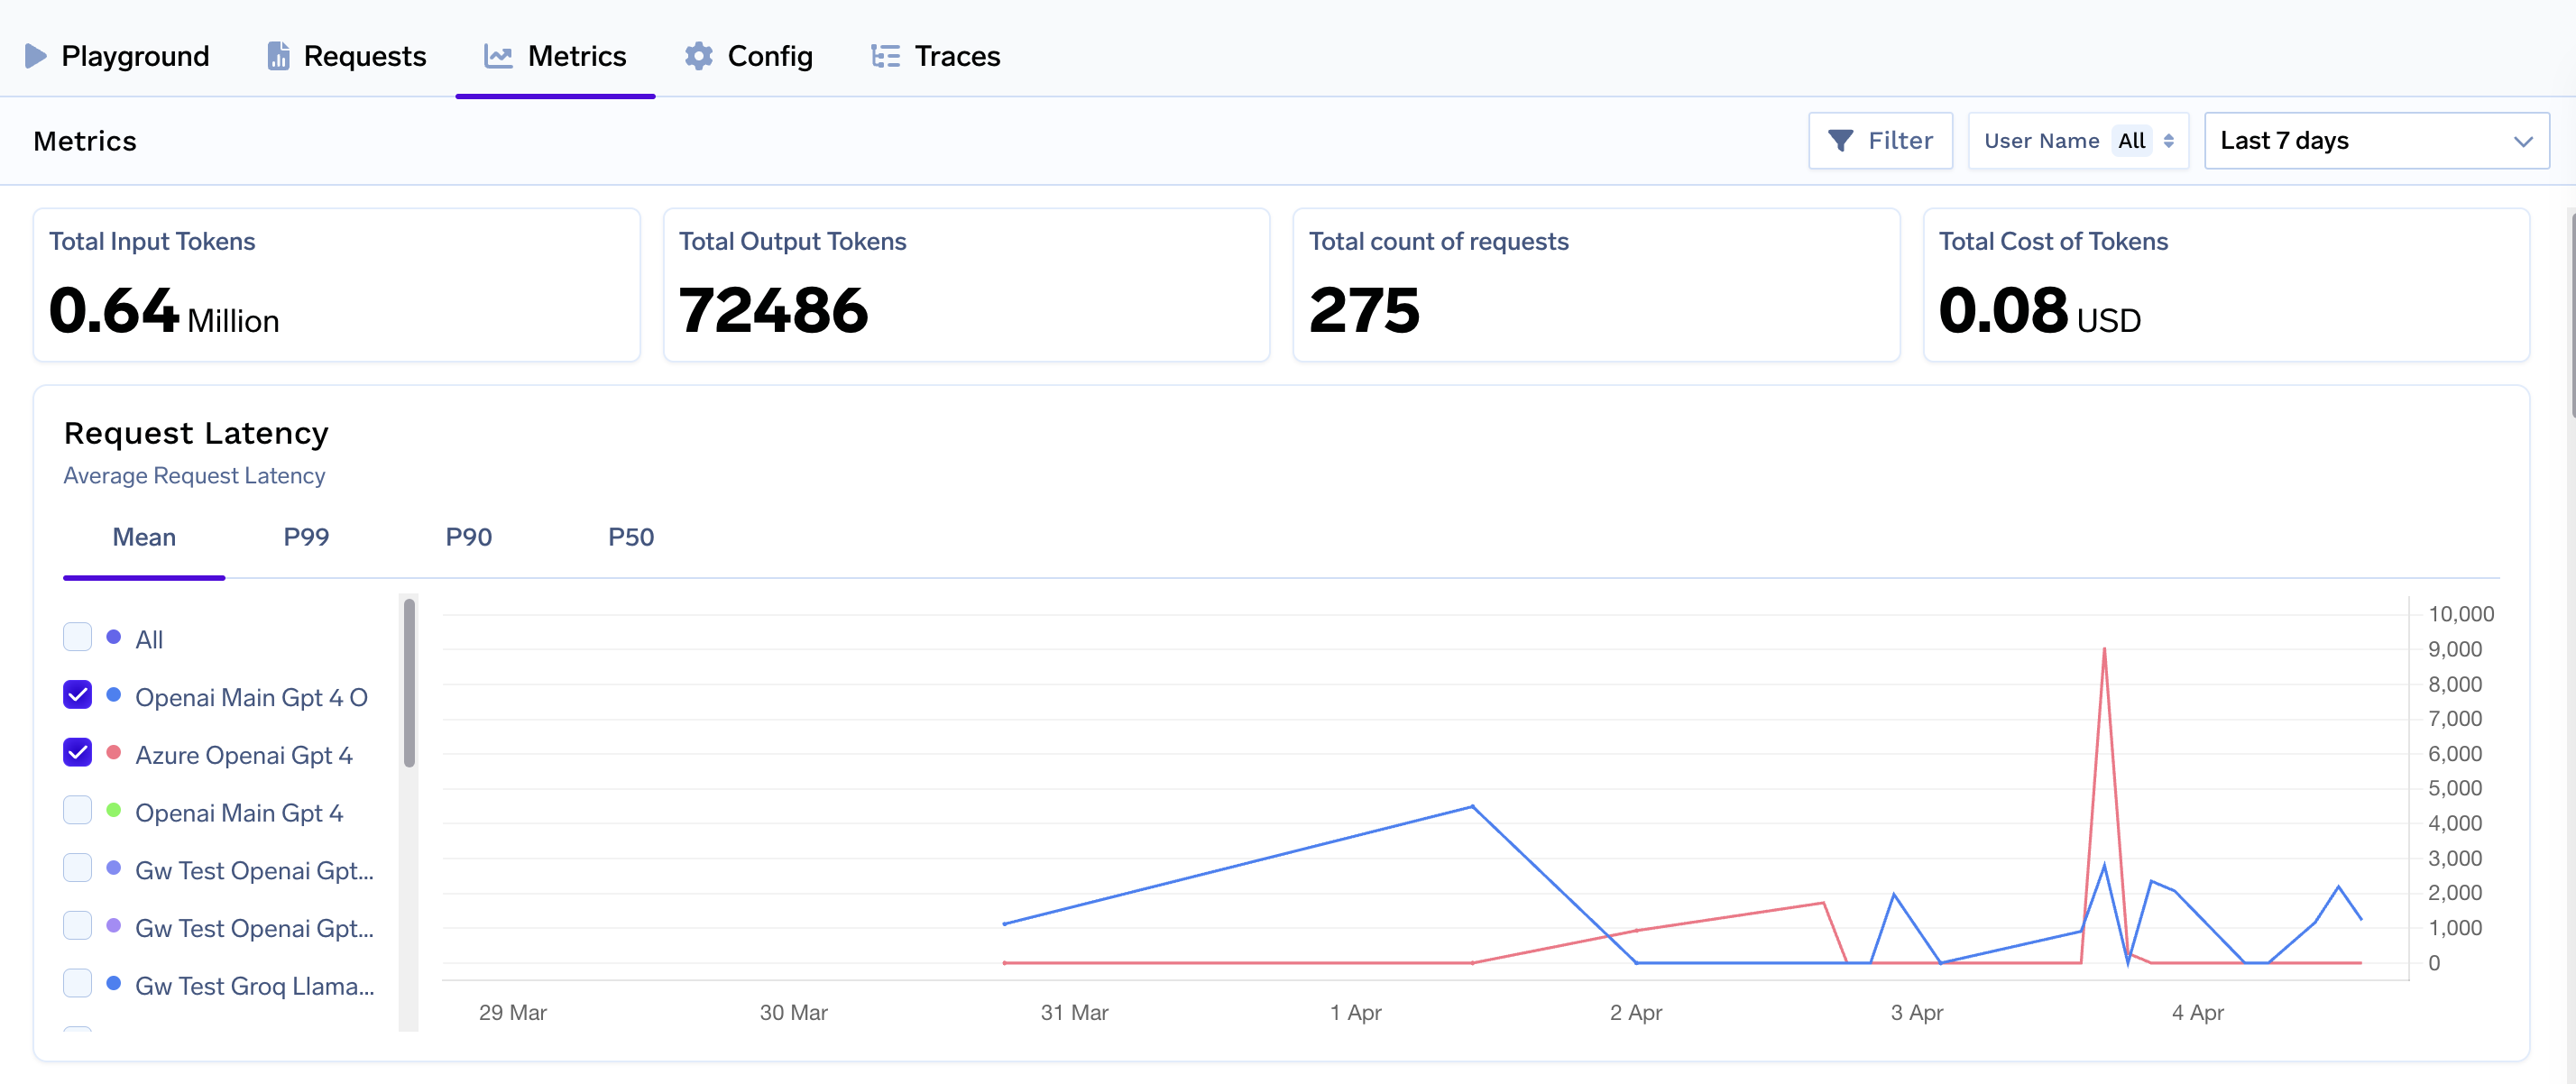
Access cumulative data on key metrics such as input/output tokens, number of requests, and token costs. Additionally, you'll find detailed latency metrics for each individual model, including mean, P99, P90, and P50 percentiles.
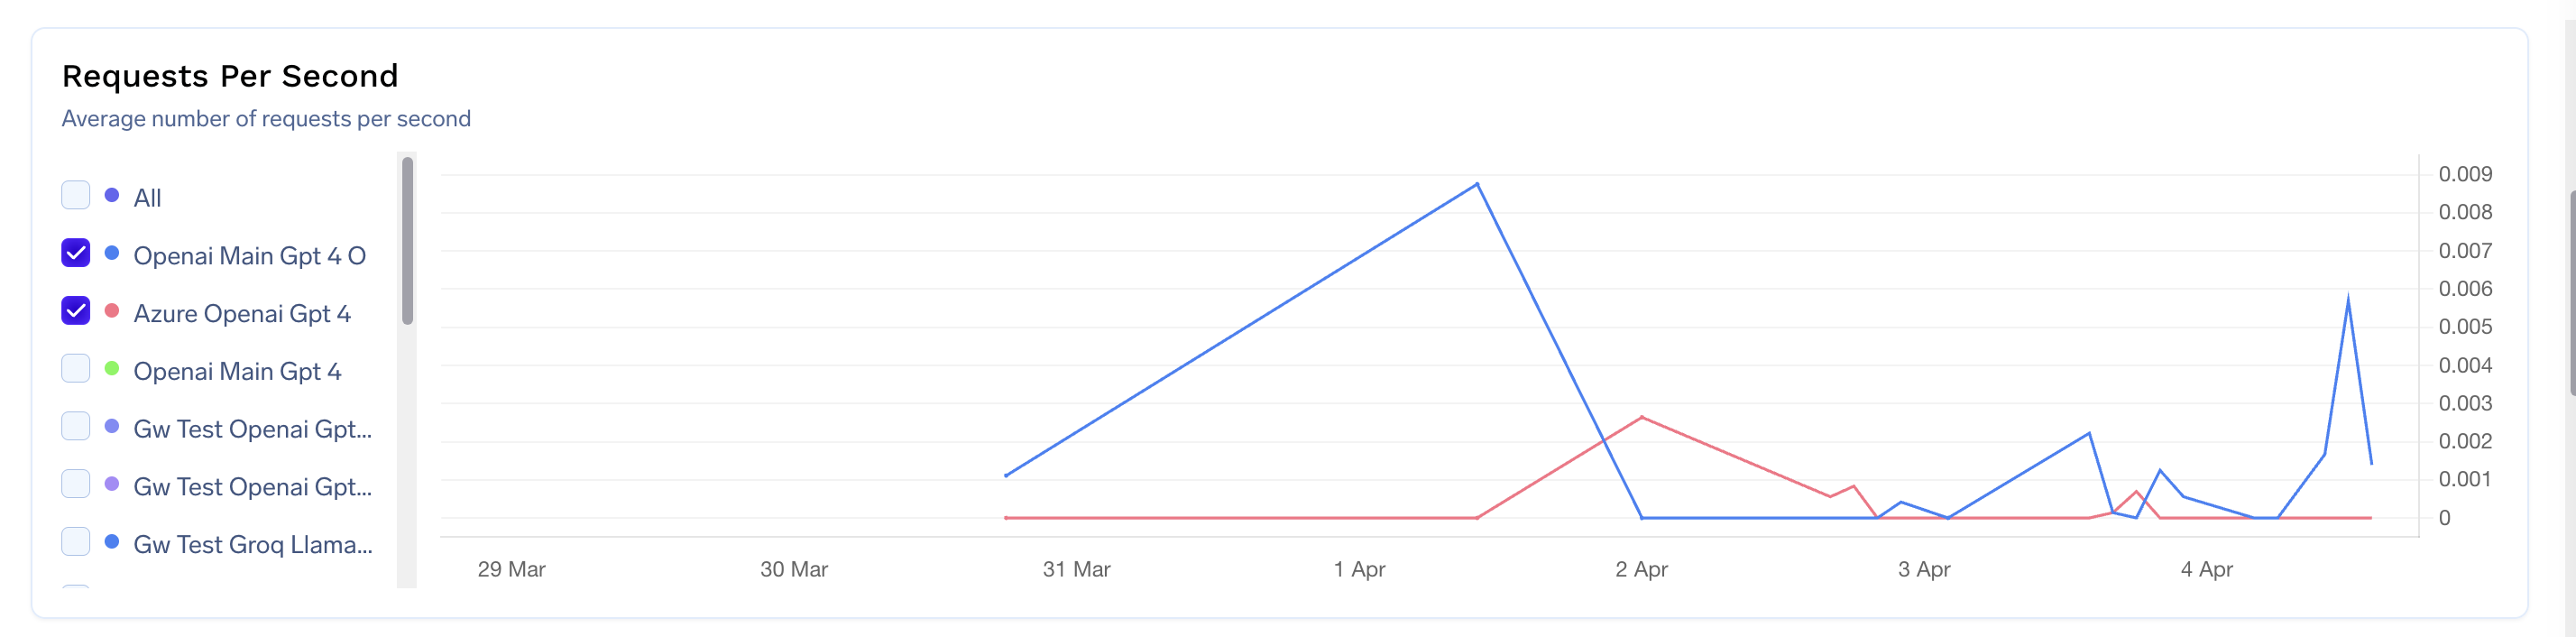
Analyse and gather insights on request/second for individual models
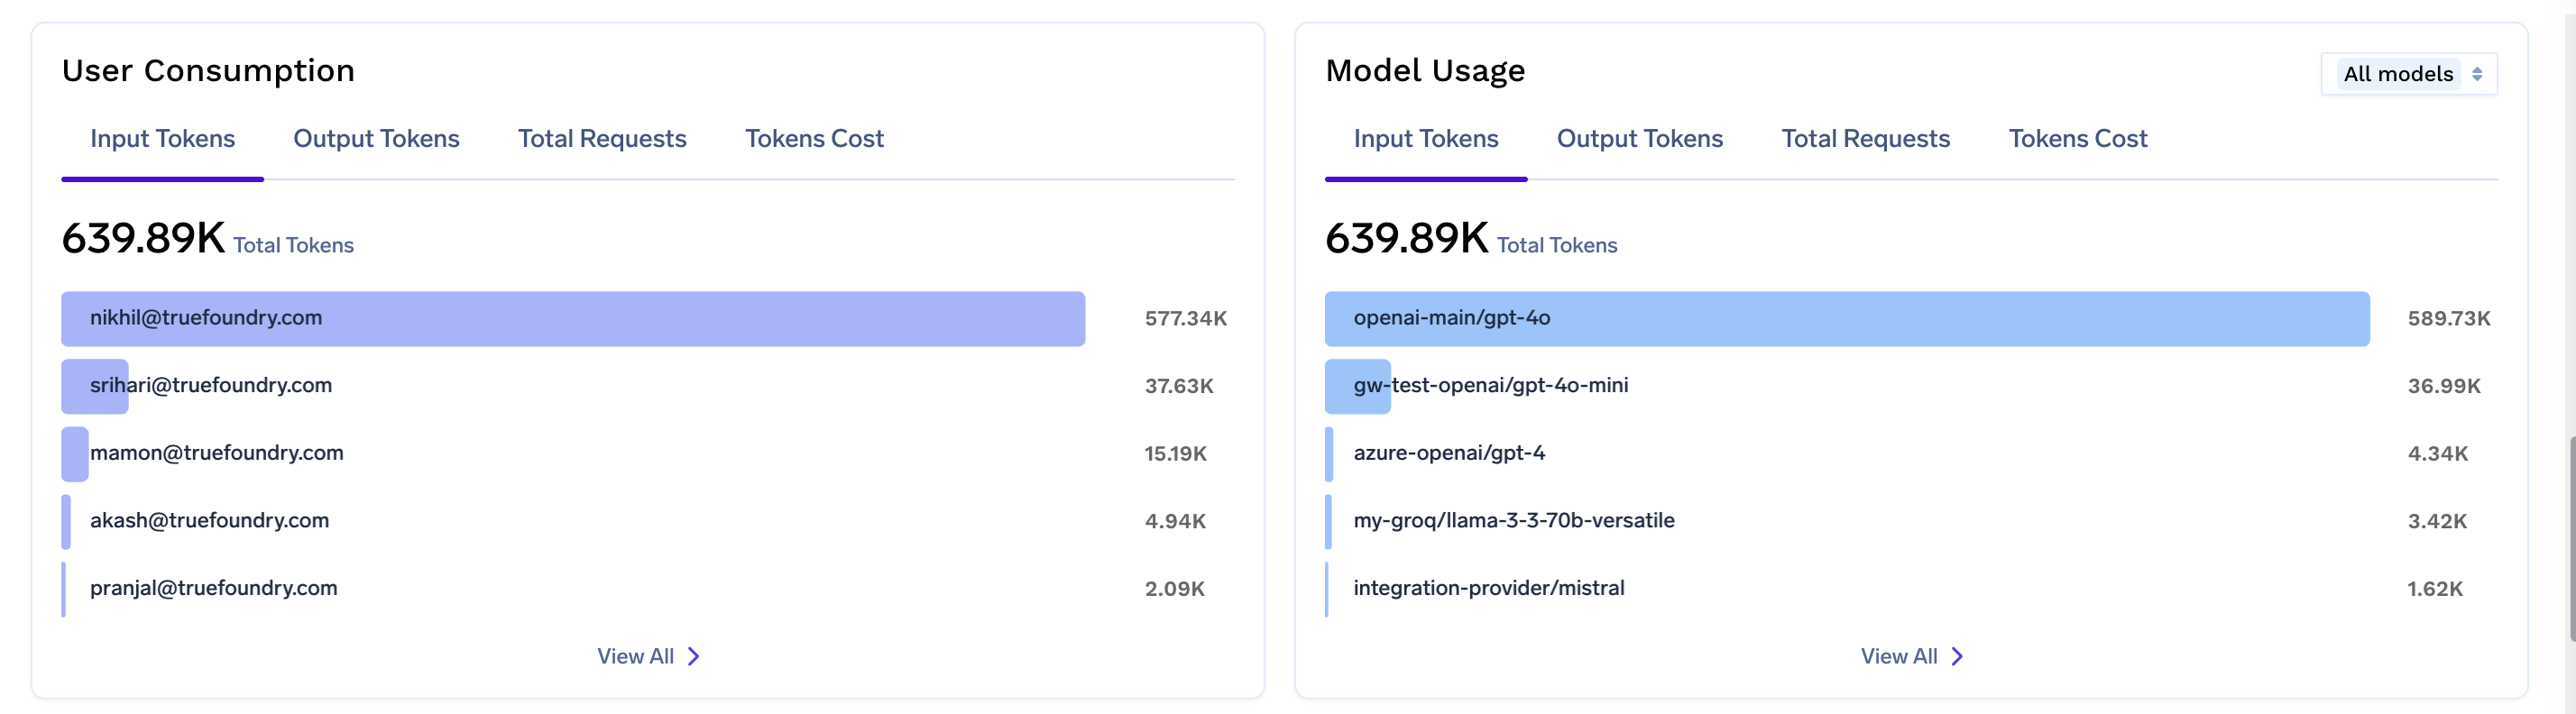
Get detailed breakdown of input/output tokens, total requests and total cost for individual users and models
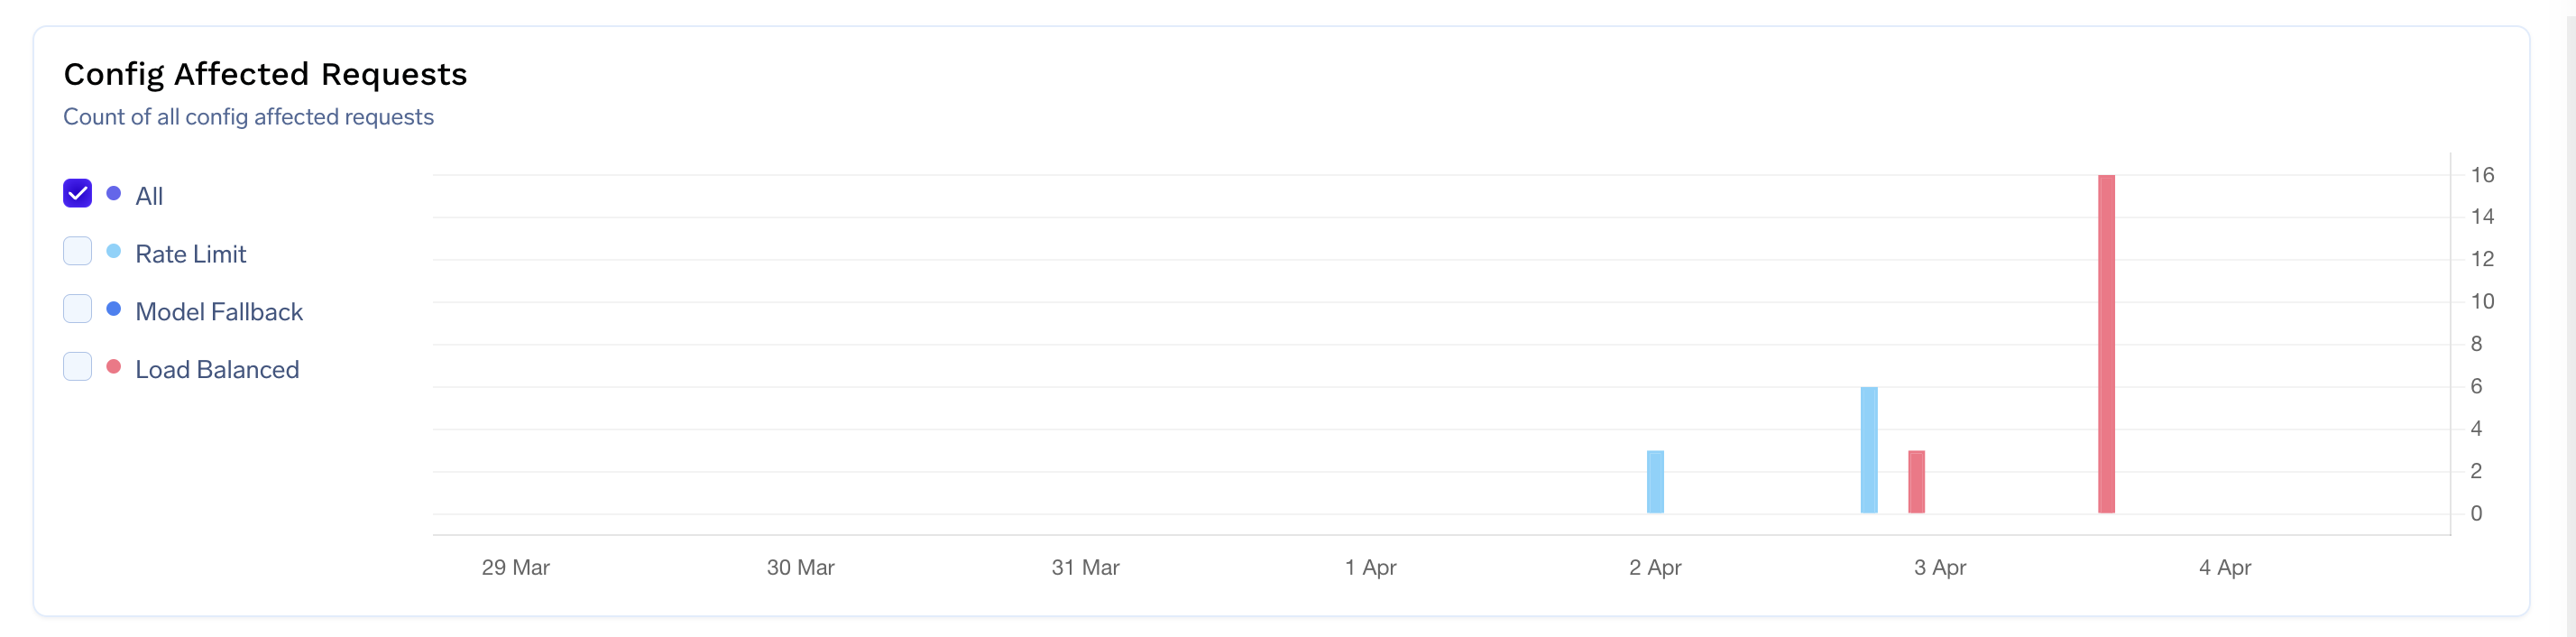
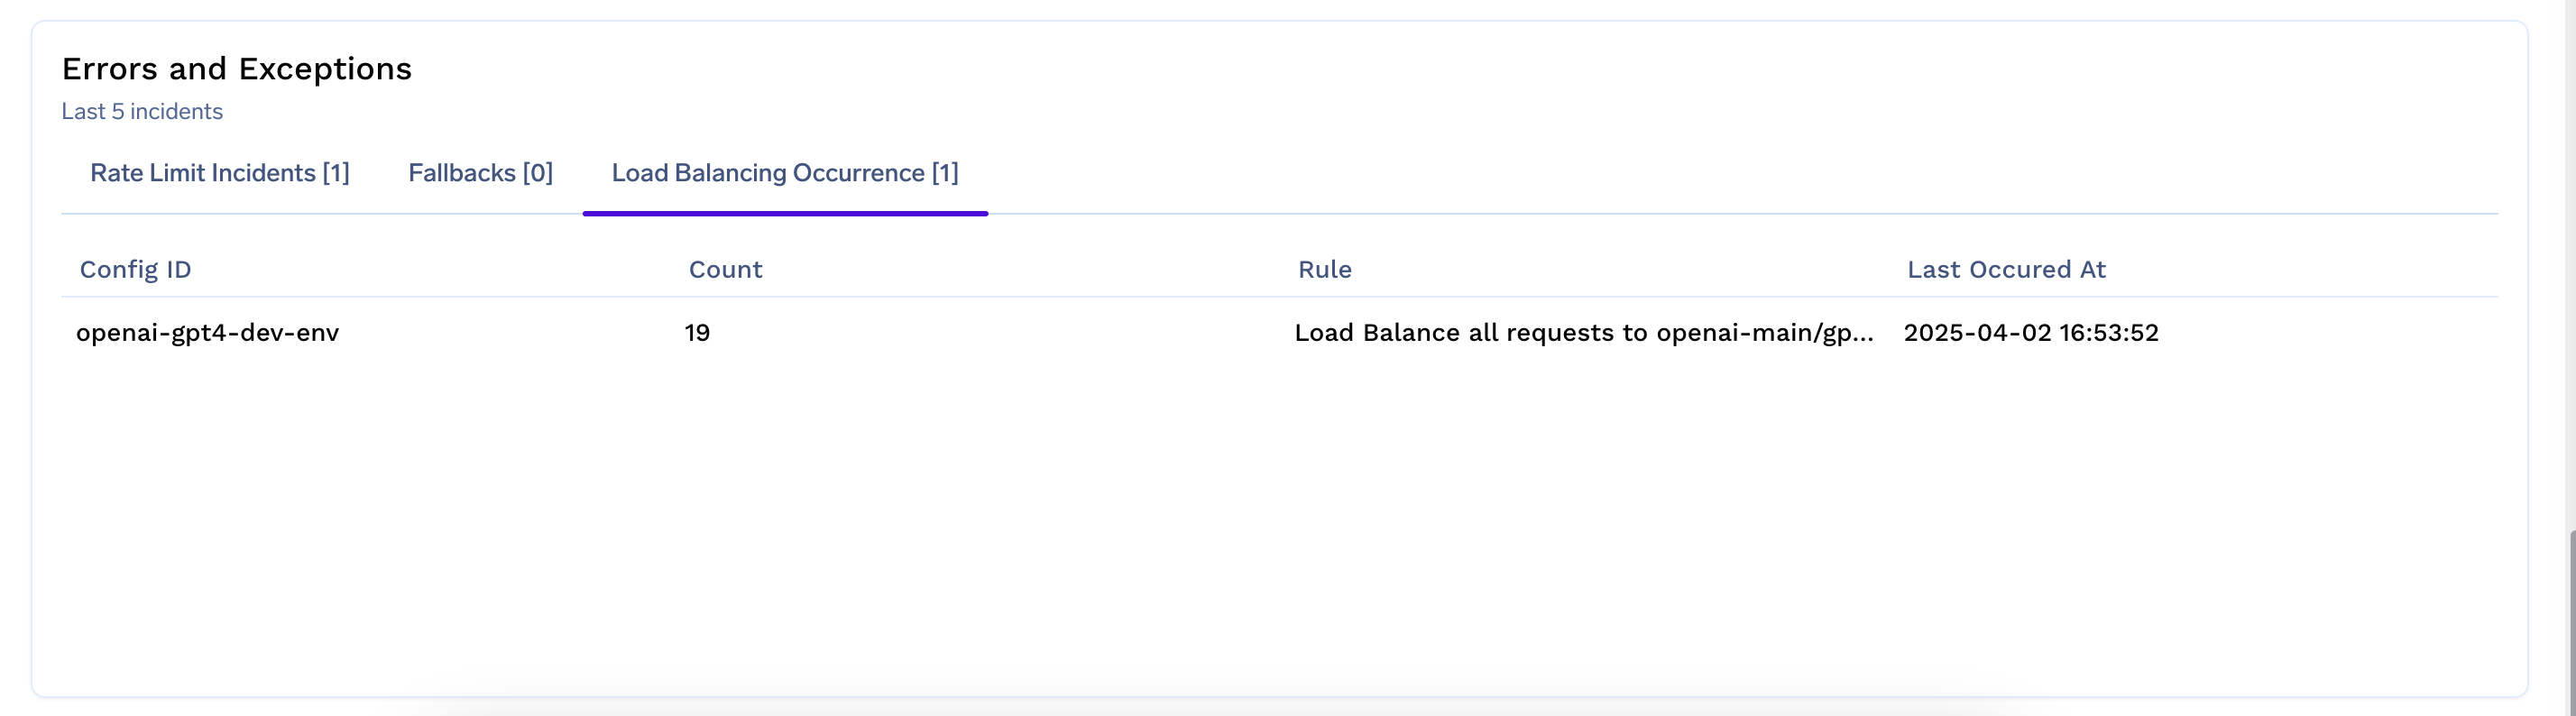
You can also analyse requests that are rate-limited, use fallbacks, or are load-balanced, along with detailed information on the rules that were applied.
Updated 19 days ago