Request Logging and Metrics
Gateway provides you with the feature to log requests/response and metrics like tokens consumed with each request.
Programatically Access Request Logs
import requests
import json

try:
    response = requests.post(
        "https://internal.devtest.truefoundry.tech/api/svc/v1/llm-gateway/requests",
        headers = {
            "Authorization": "Bearer <Paste your API key here. You can generate it from the Settings Page>"
        },
        json =  {
  "filter": {
    "created_at": [
      {
        "key": "created_at",
        "value": 1731577557568,
        "operator": "LT"
      },
      {
        "key": "created_at",
        "value": 1731566757568,
        "operator": "GTE"
      }
    ]
  },
  "sort": [
    {
      "key": "created_at",
      "order": "DESC"
    }
  ],
  "limit": 25,
  "offset": 0
}
    )
    response.raise_for_status()
    print(response.status_code)
    print(response.json())
except requests.exceptions.HTTPError as http_error:
    print("HTTP error occurred:", http_error)
curl -X 'POST' \
  'https://internal.devtest.truefoundry.tech/api/svc/v1/llm-gateway/requests' \
  -H 'accept: */*' \
  -H 'Authorization: Bearer <Paste your API key here. You can generate it from the Settings Page>' \
  -H 'Content-Type: application/json' \
  -d '{
  "filter": {
    "created_at": [
      {
        "key": "created_at",
        "value": 1731577557568,
        "operator": "LT"
      },
      {
        "key": "created_at",
        "value": 1731566757568,
        "operator": "GTE"
      }
    ]
  },
  "sort": [
    {
      "key": "created_at",
      "order": "DESC"
    }
  ],
  "limit": 25,
  "offset": 0
}'
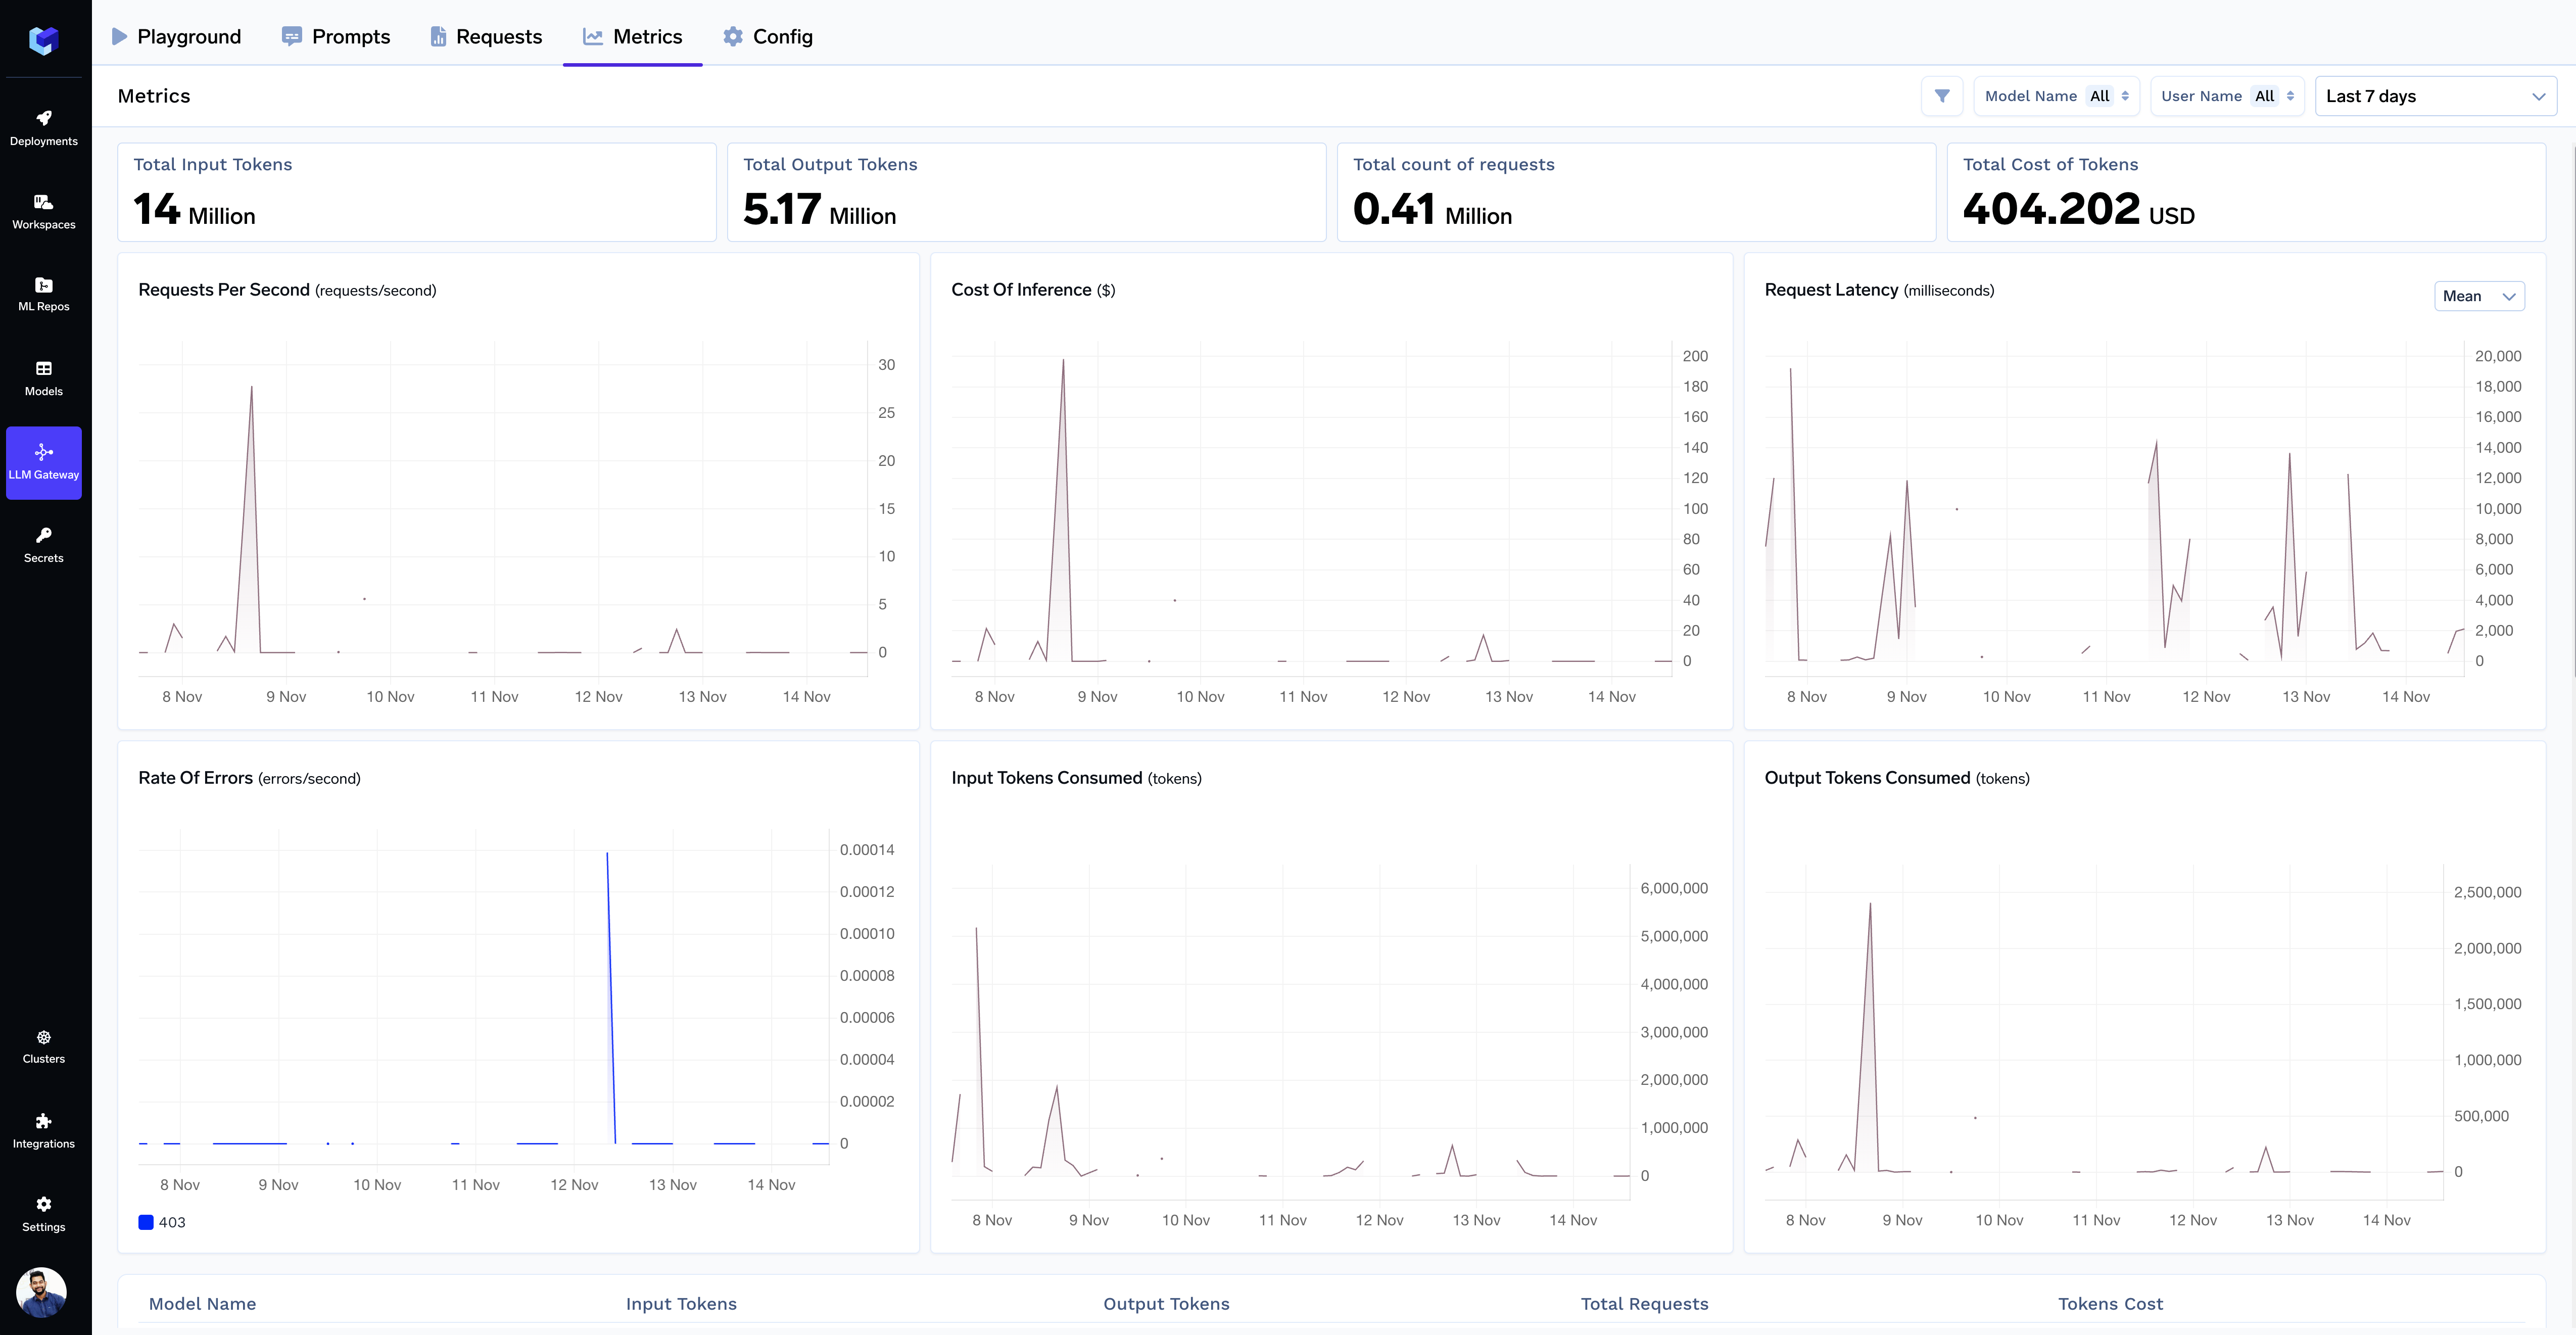
Visual and Tabular Metrics
You can filter by model and user for a specified period on the Metrics Page to view various metrics, including input tokens, output tokens, total requests, and tokens cost. This can be useful in model and user activity analysis as well as cost management.
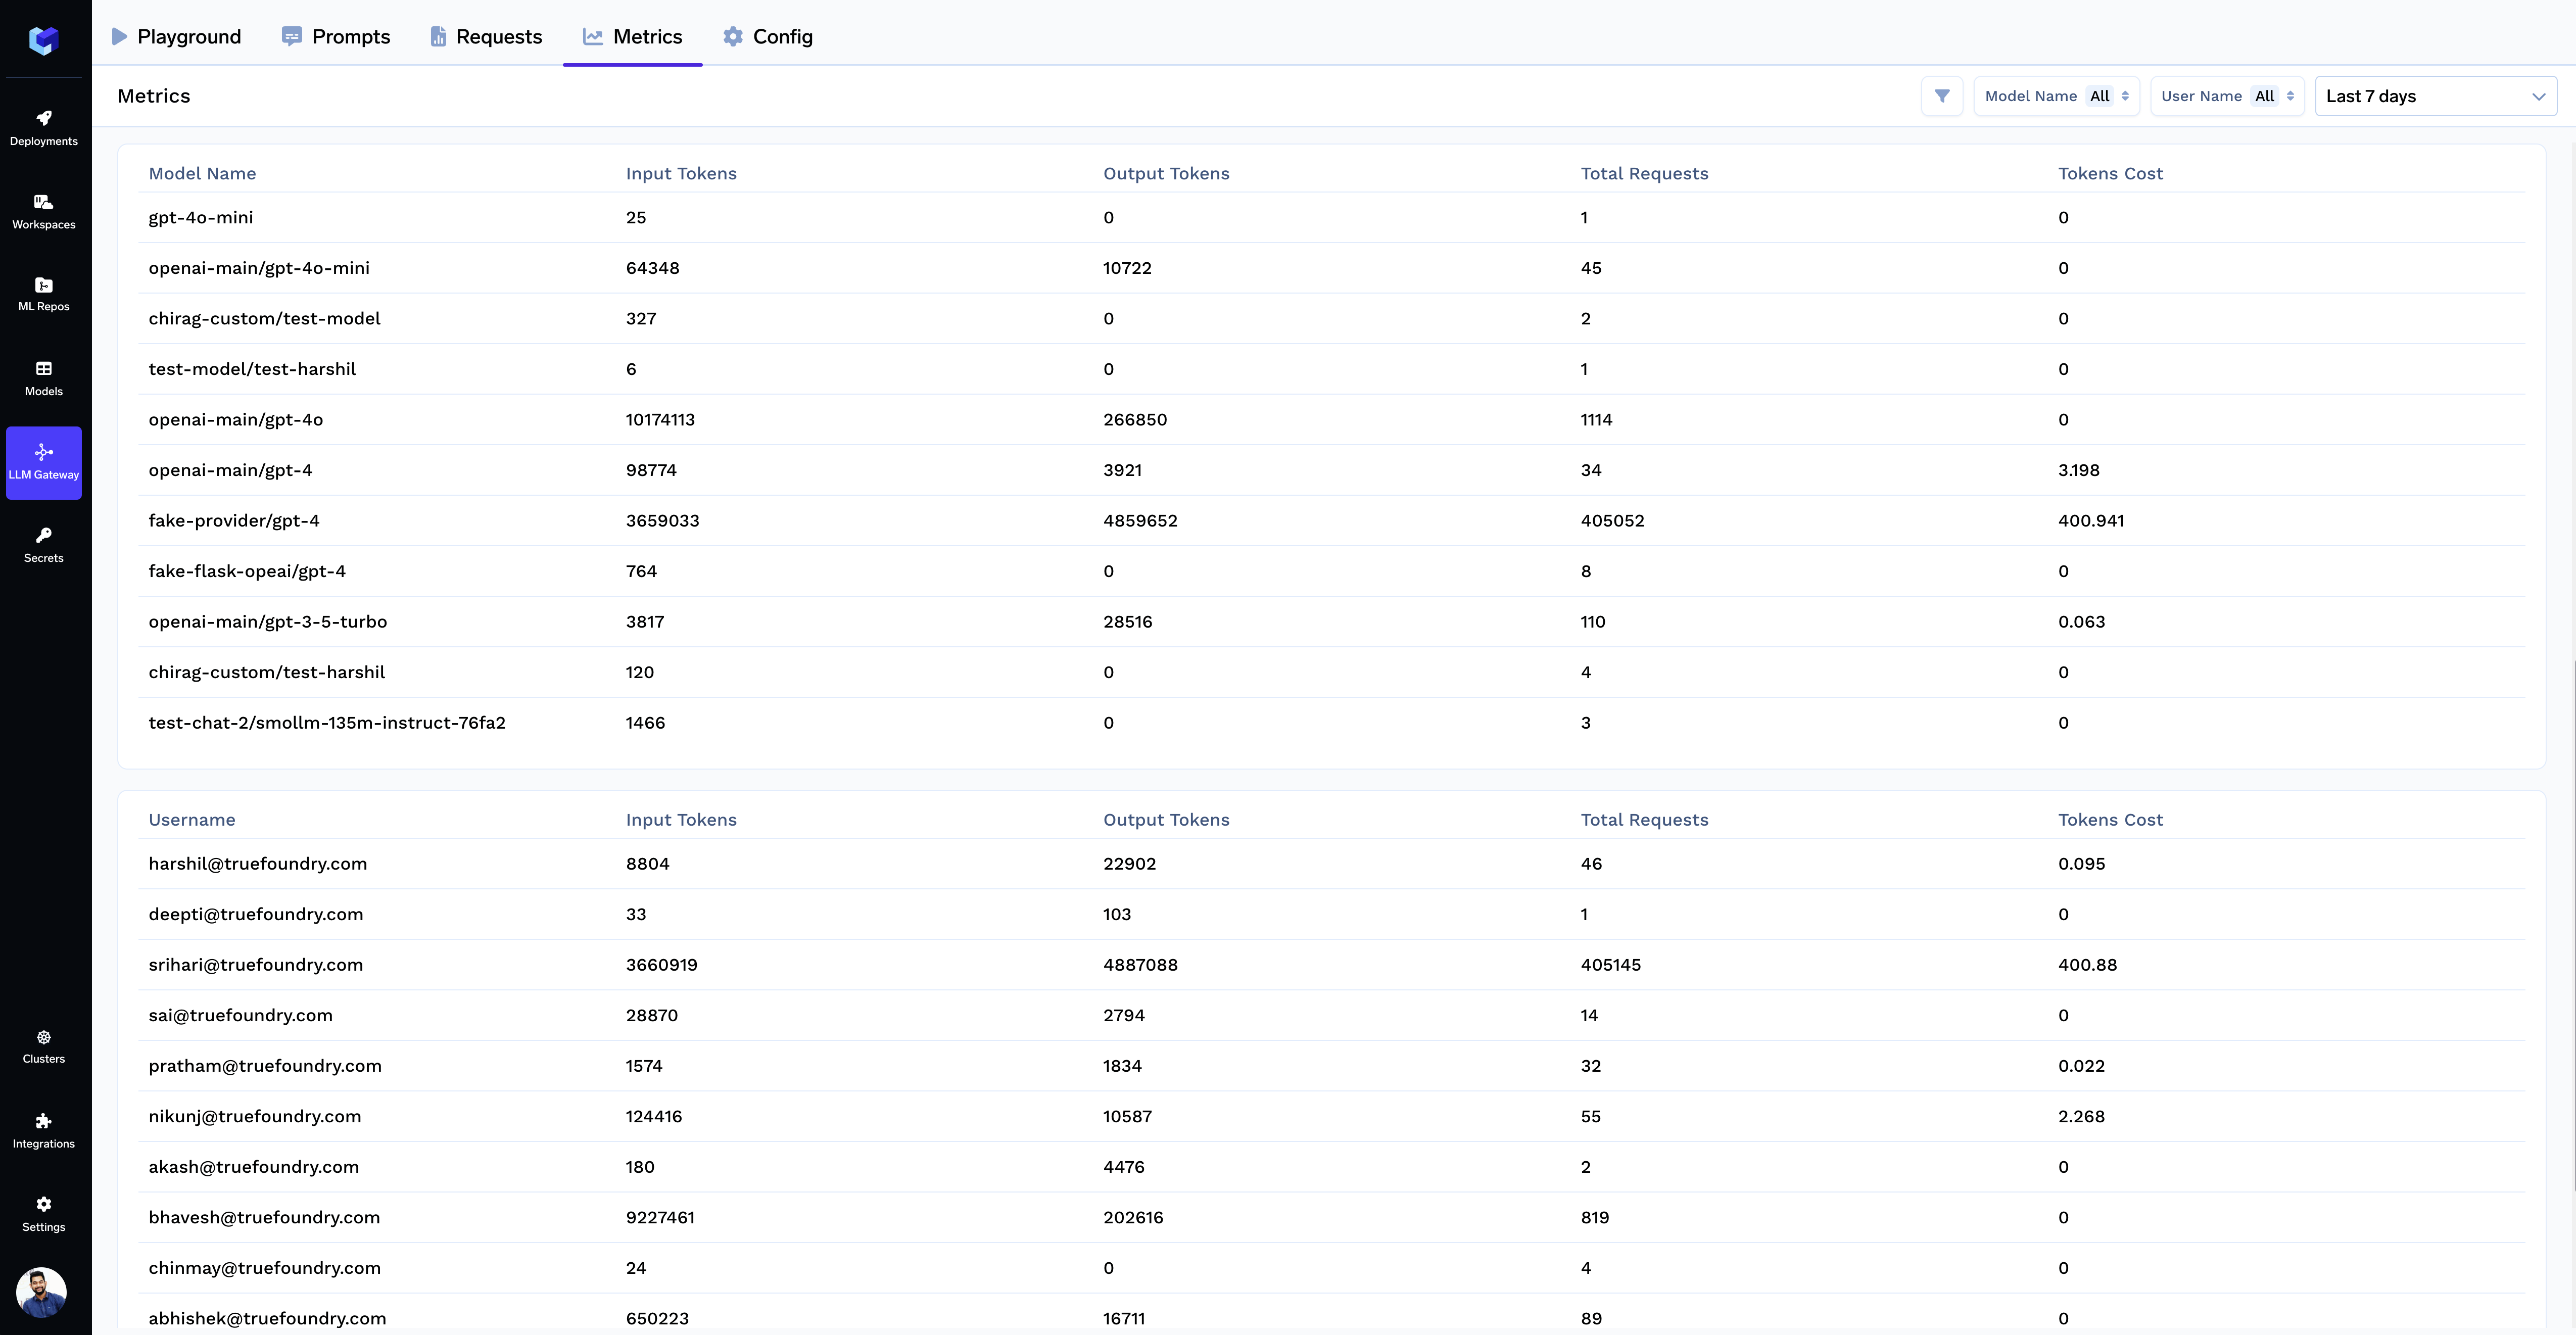
These metrics are accessible in both graphical and tabular formats for easy analysis and interpretation.
Visual representation
Tabular representation
Updated about 1 month ago