Enable Monitoring
How to enable monitoring in the cluster
Monitoring can be very helpful in the platform to understand and resolve issues related to your applications. For this our custom applications supports Prometheus (including Grafana) and Loki that can be installed in your workload cluster. Once the applications (Prometheus and Loki) are installed in the cluster you can enable monitoring by
- Go to Integrations tab and chose your workload cluster.
- Click on Edit on the cluster where you want to enable monitoring.
- Turn on the monitoring section
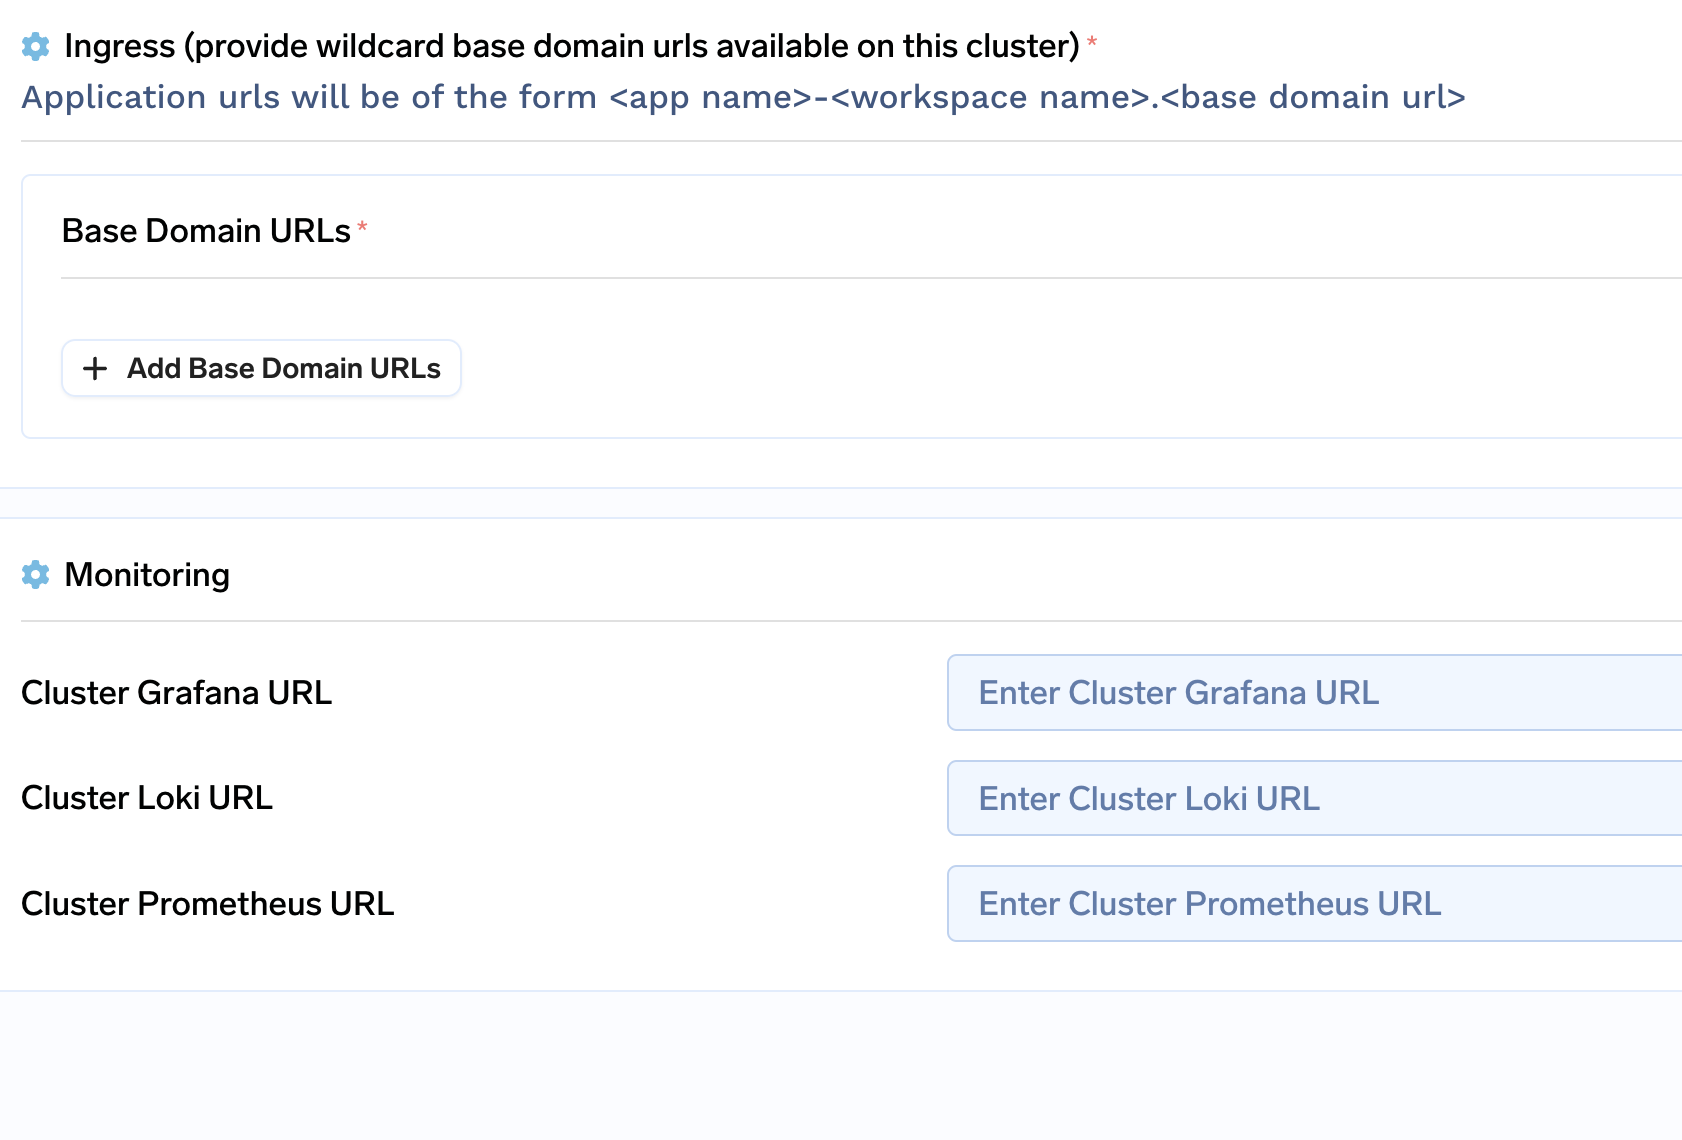
- Enter these values
Cluster Grafana URL - http://prometheus-grafana.prometheus.svc.cluster.local:80 Cluster Loki URL - http://loki.loki.svc.cluster.local:3100 Cluster Prometheus URL - http://prometheus-operated.prometheus.svc.cluster.local:9090/ - The above URL will remain same unless we have used a different namespace or a different chart altogether.
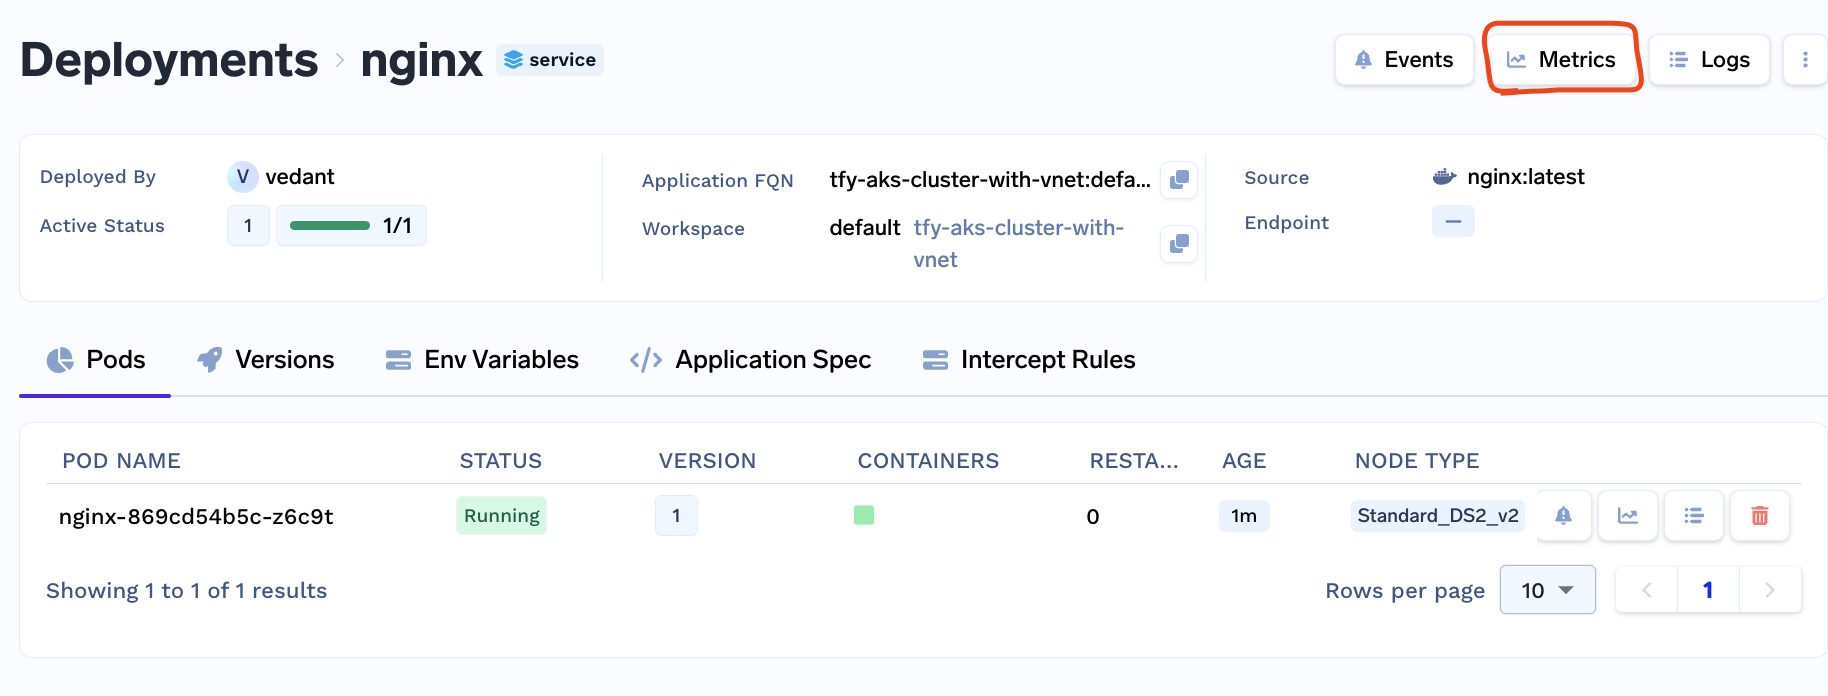
- Once the cluster is updated you can go ahead in the Deployments section and chose to see metrics for any deployment.
Updated 8 months ago