Key Components of an Alert
An alert primarily comprises of two components:- Alert Rule: This is a rule in terms of a PromQL query that is evaluated periodically to check if its true. If its true for a
configured duration, the alert is triggered.
- Severity: This is the severity of the alert which is used to categorize if the alert needs immediate attention or not. It can be either
warningorcritical. This can be used in PagerDuty to route the alert to the proper channel. - Notification Channel: These are the channels where the alerts will be sent once they are triggered.
Setting up alerts in Truefoundry Services
To setup alerts, you need to follow the steps below:1. Setup Notification Channels
Before setting up the alerts, you have to configure the notification channels and add one or more notification channels to send alerts to.
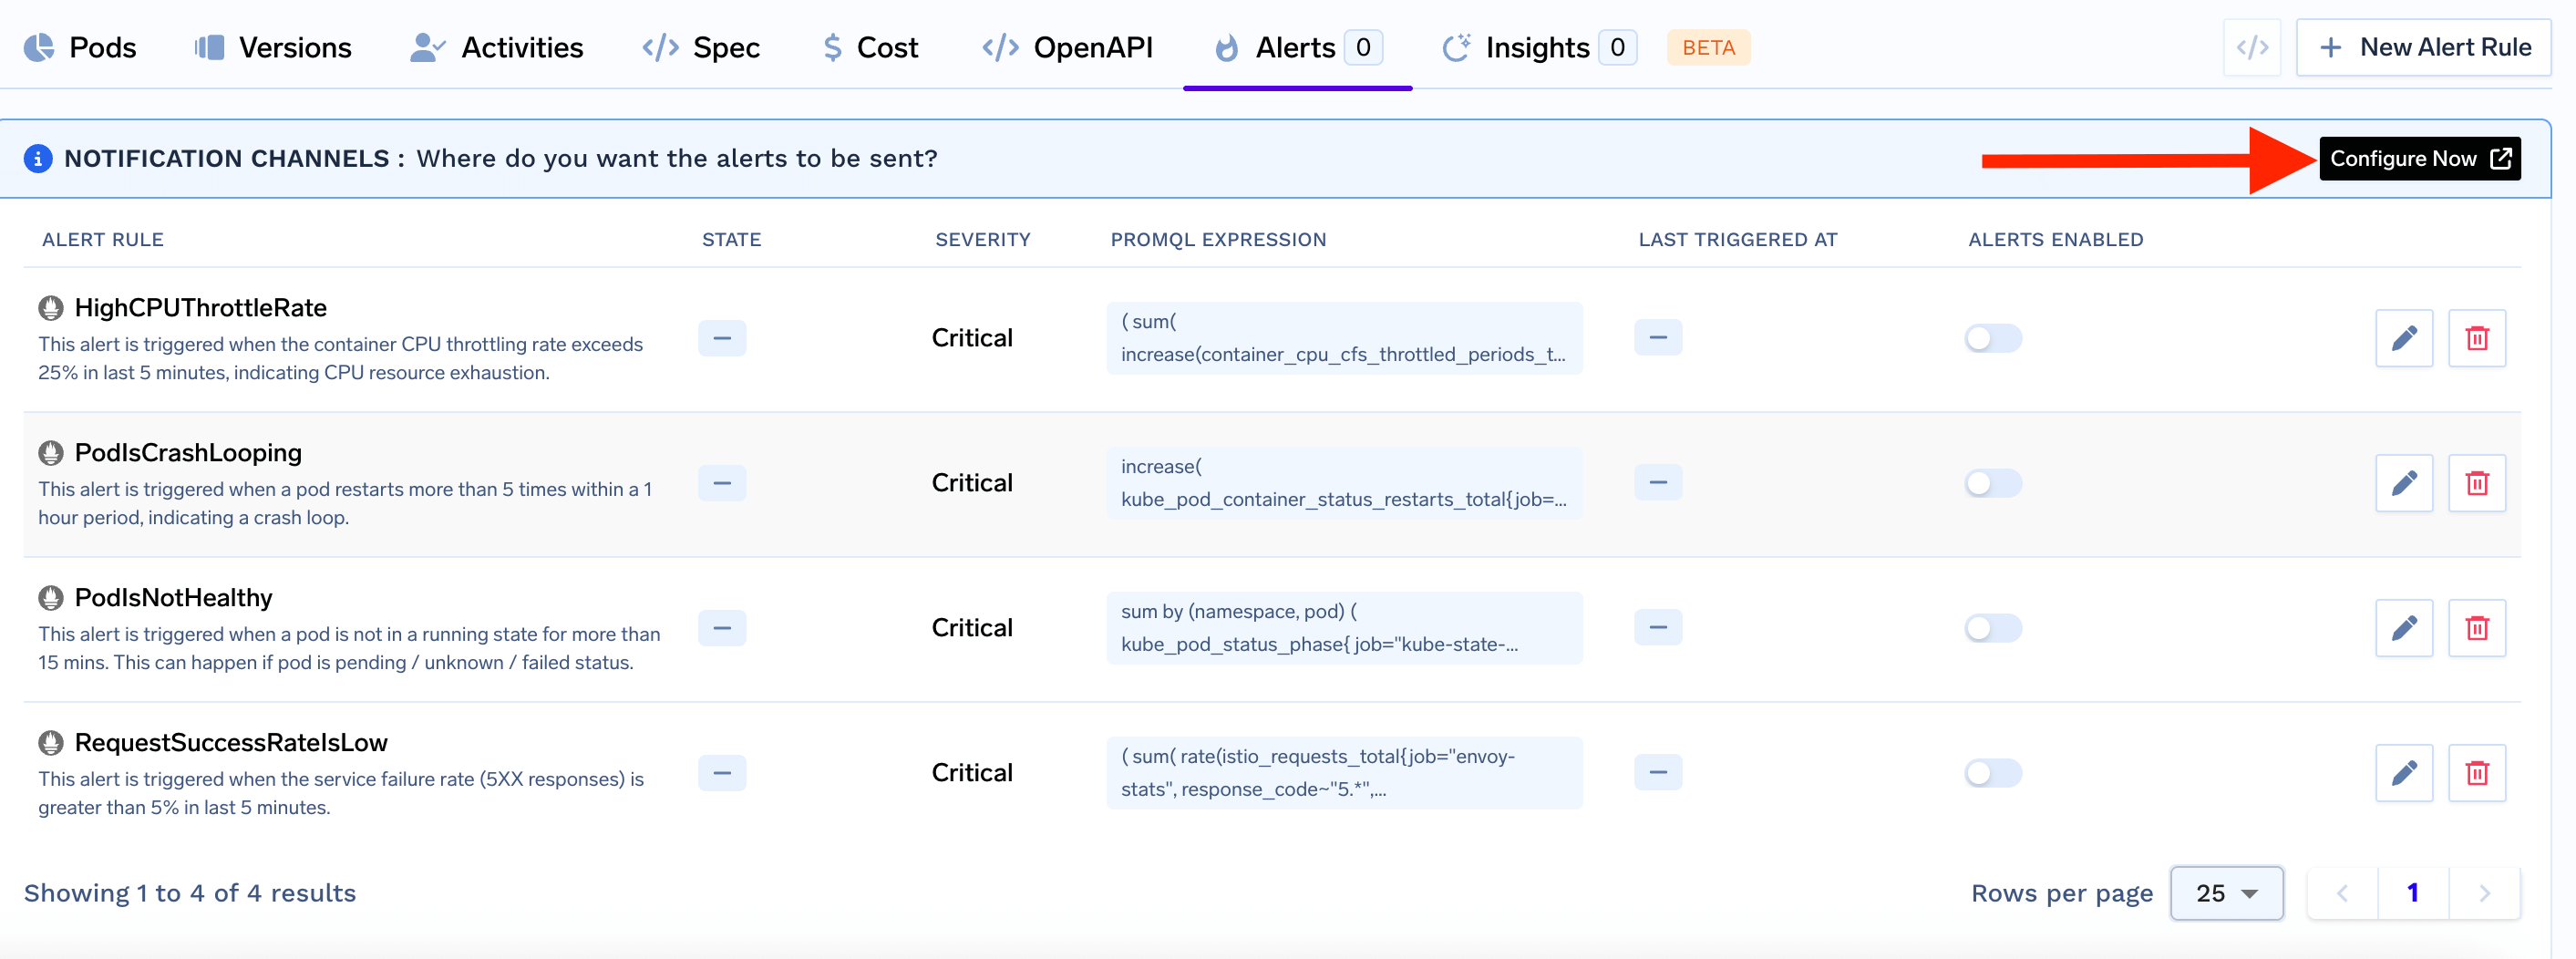
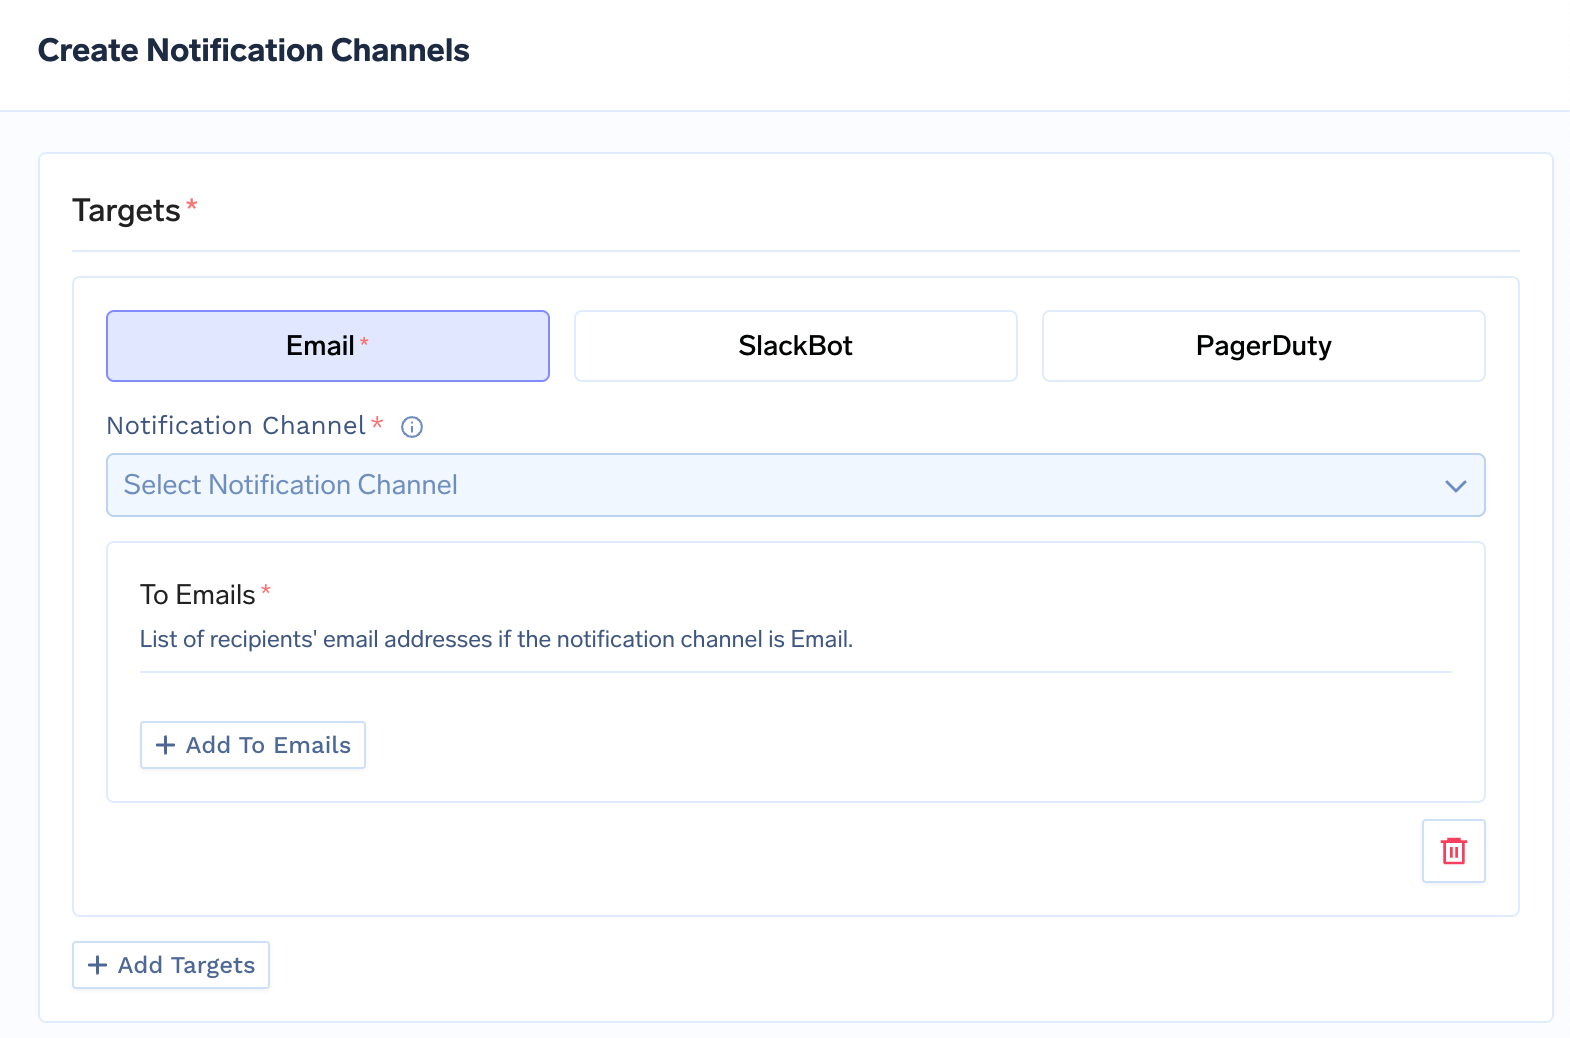
You can add multiple notification channels to send alerts to.
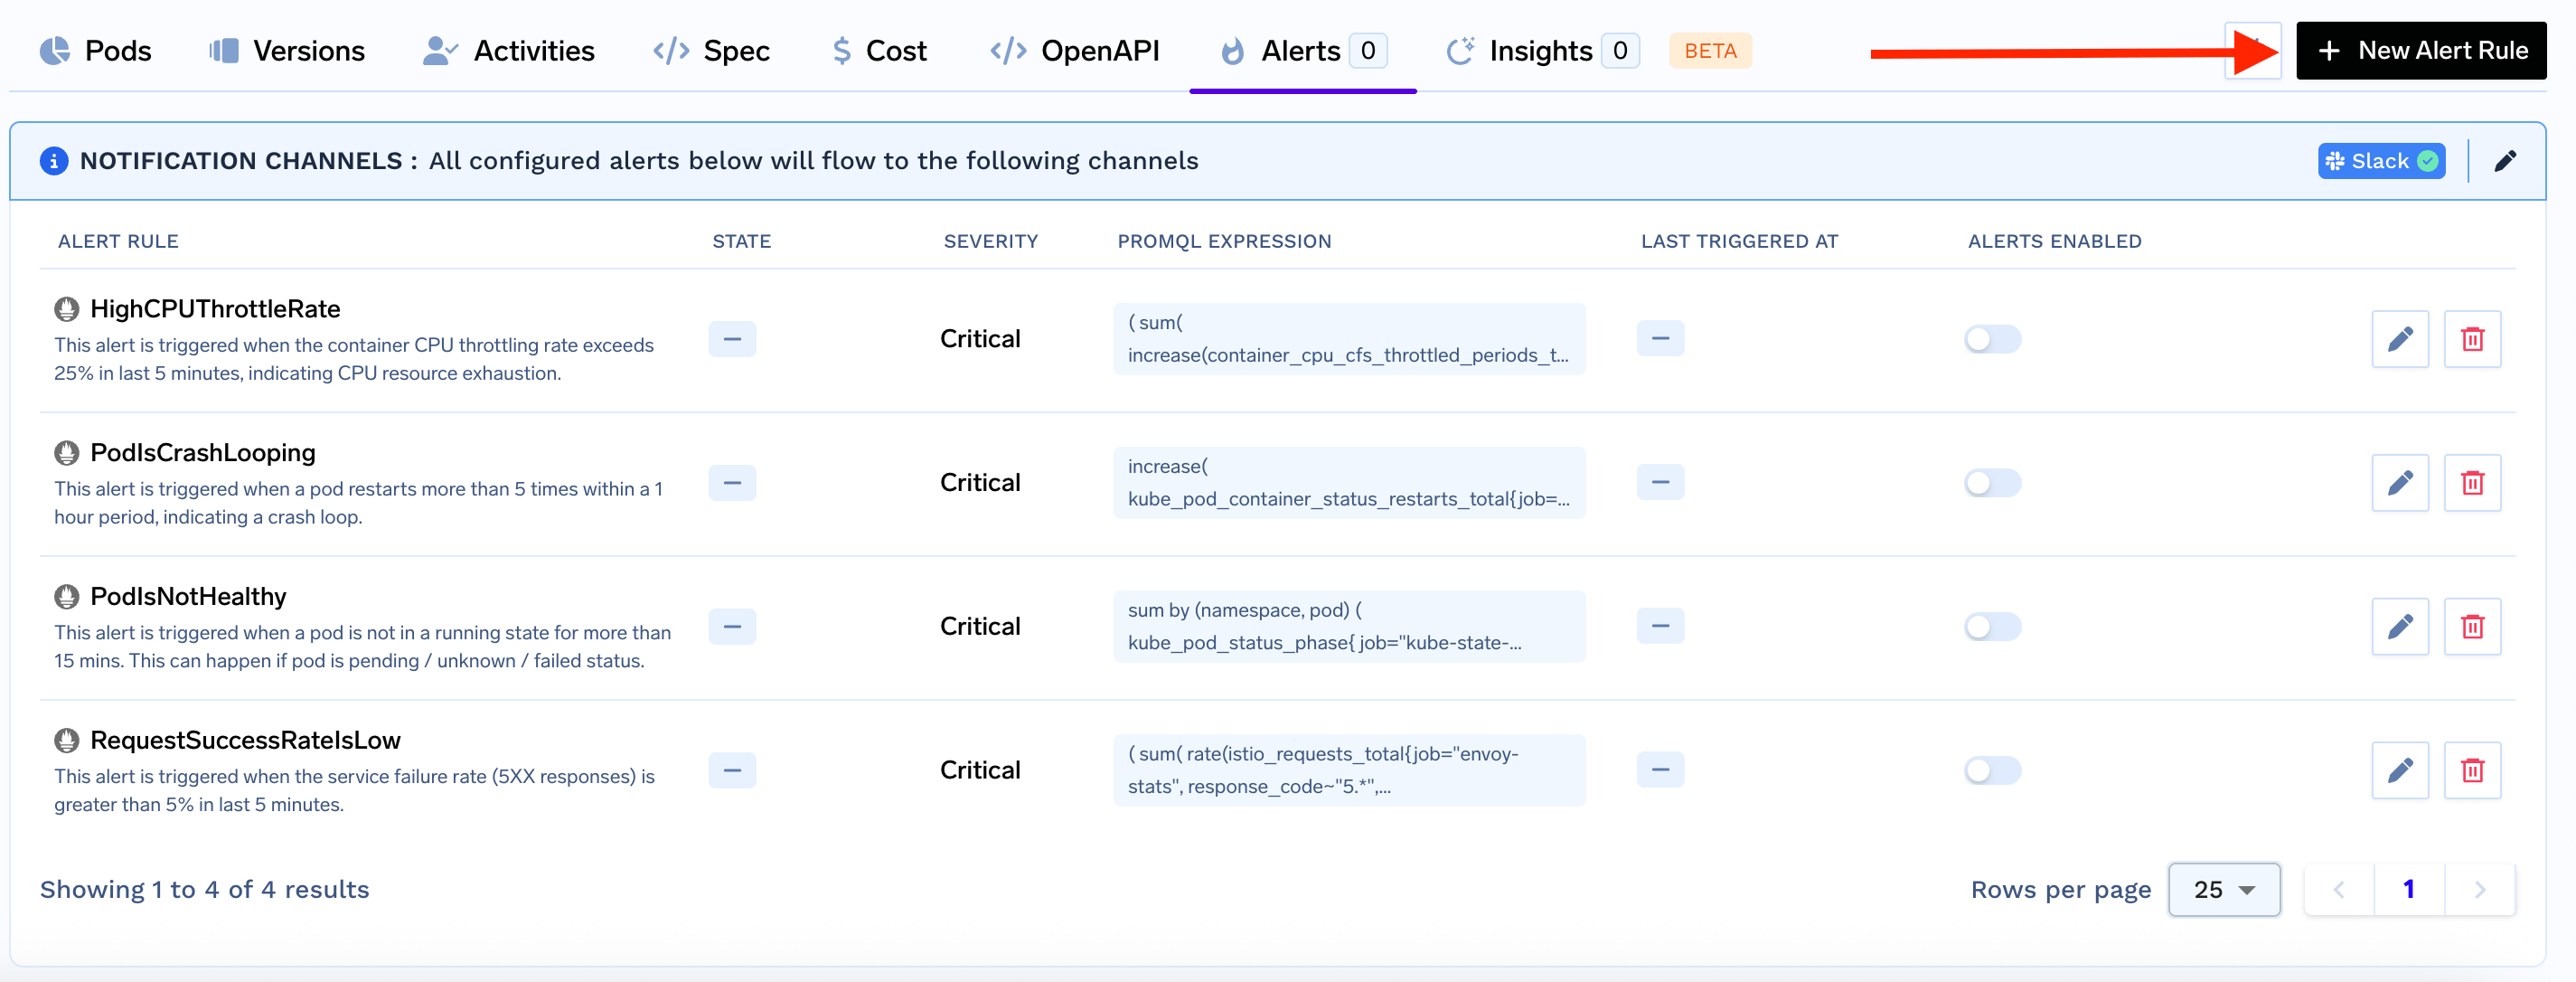
2. Create Alert
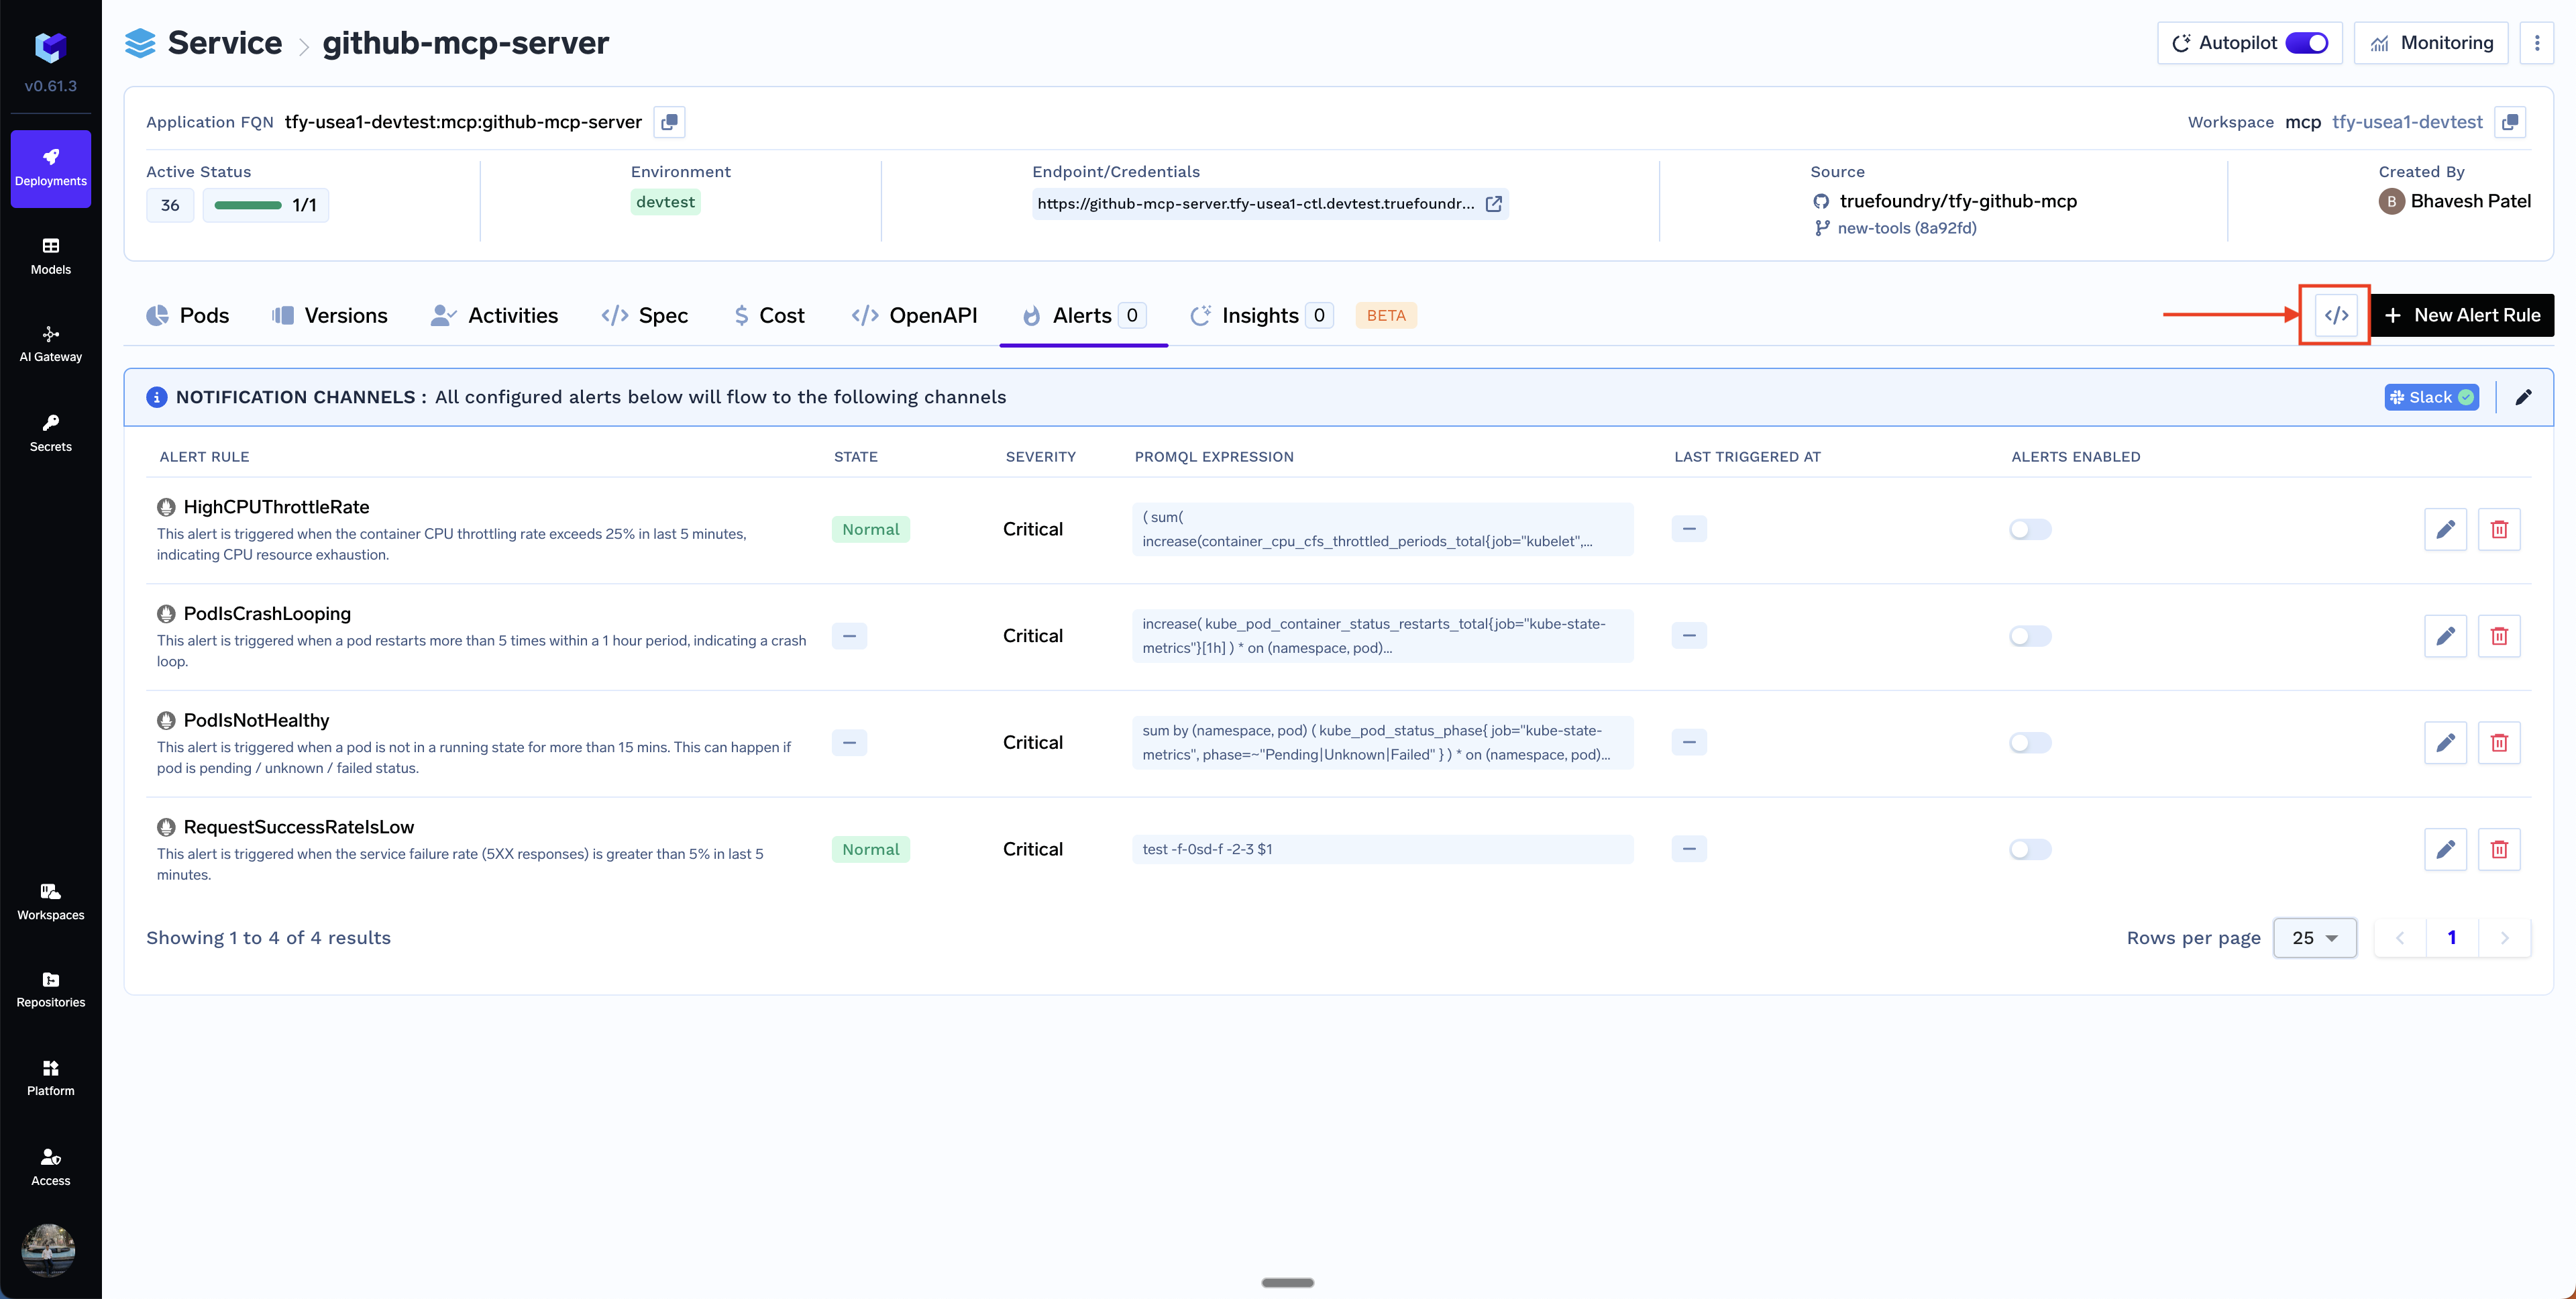
You can choose among the already available alerts or create your own custom alert. In most of the cases, the existing alerts should suffice for your usecase. Here are a few of the alerts already available:HighCPUThrottleRate
HighCPUThrottleRate
This alert is triggered when the container CPU throttling rate exceeds 25% in the last 5 minutes, indicating CPU resource exhaustion. This means it might be affecting the latency or throughput of the service. The solution is usually to increase the CPU request and limit of the service.
PodIsCrashLooping
PodIsCrashLooping
This alert is triggered when a pod restarts more than 5 times within a 1 hour period, indicating a crash loop. You should check the logs and events to understand the root cause of the crash.
PodIsNotHealthy
PodIsNotHealthy
This alert is triggered when a pod is not in a running state for more than 15 minutes. This can happen if the pod is in pending, unknown, or failed status. This can happen if we cannot provision an instance or there is an application error. You can check the logs and events to understand the root cause of the pod not being healthy.
RequestSuccessRateIsLow
RequestSuccessRateIsLow
This alert is triggered when the requests are failing and we are getting 5XX responses. This usually happens because of a bug in the application code or some pods not running successfully.
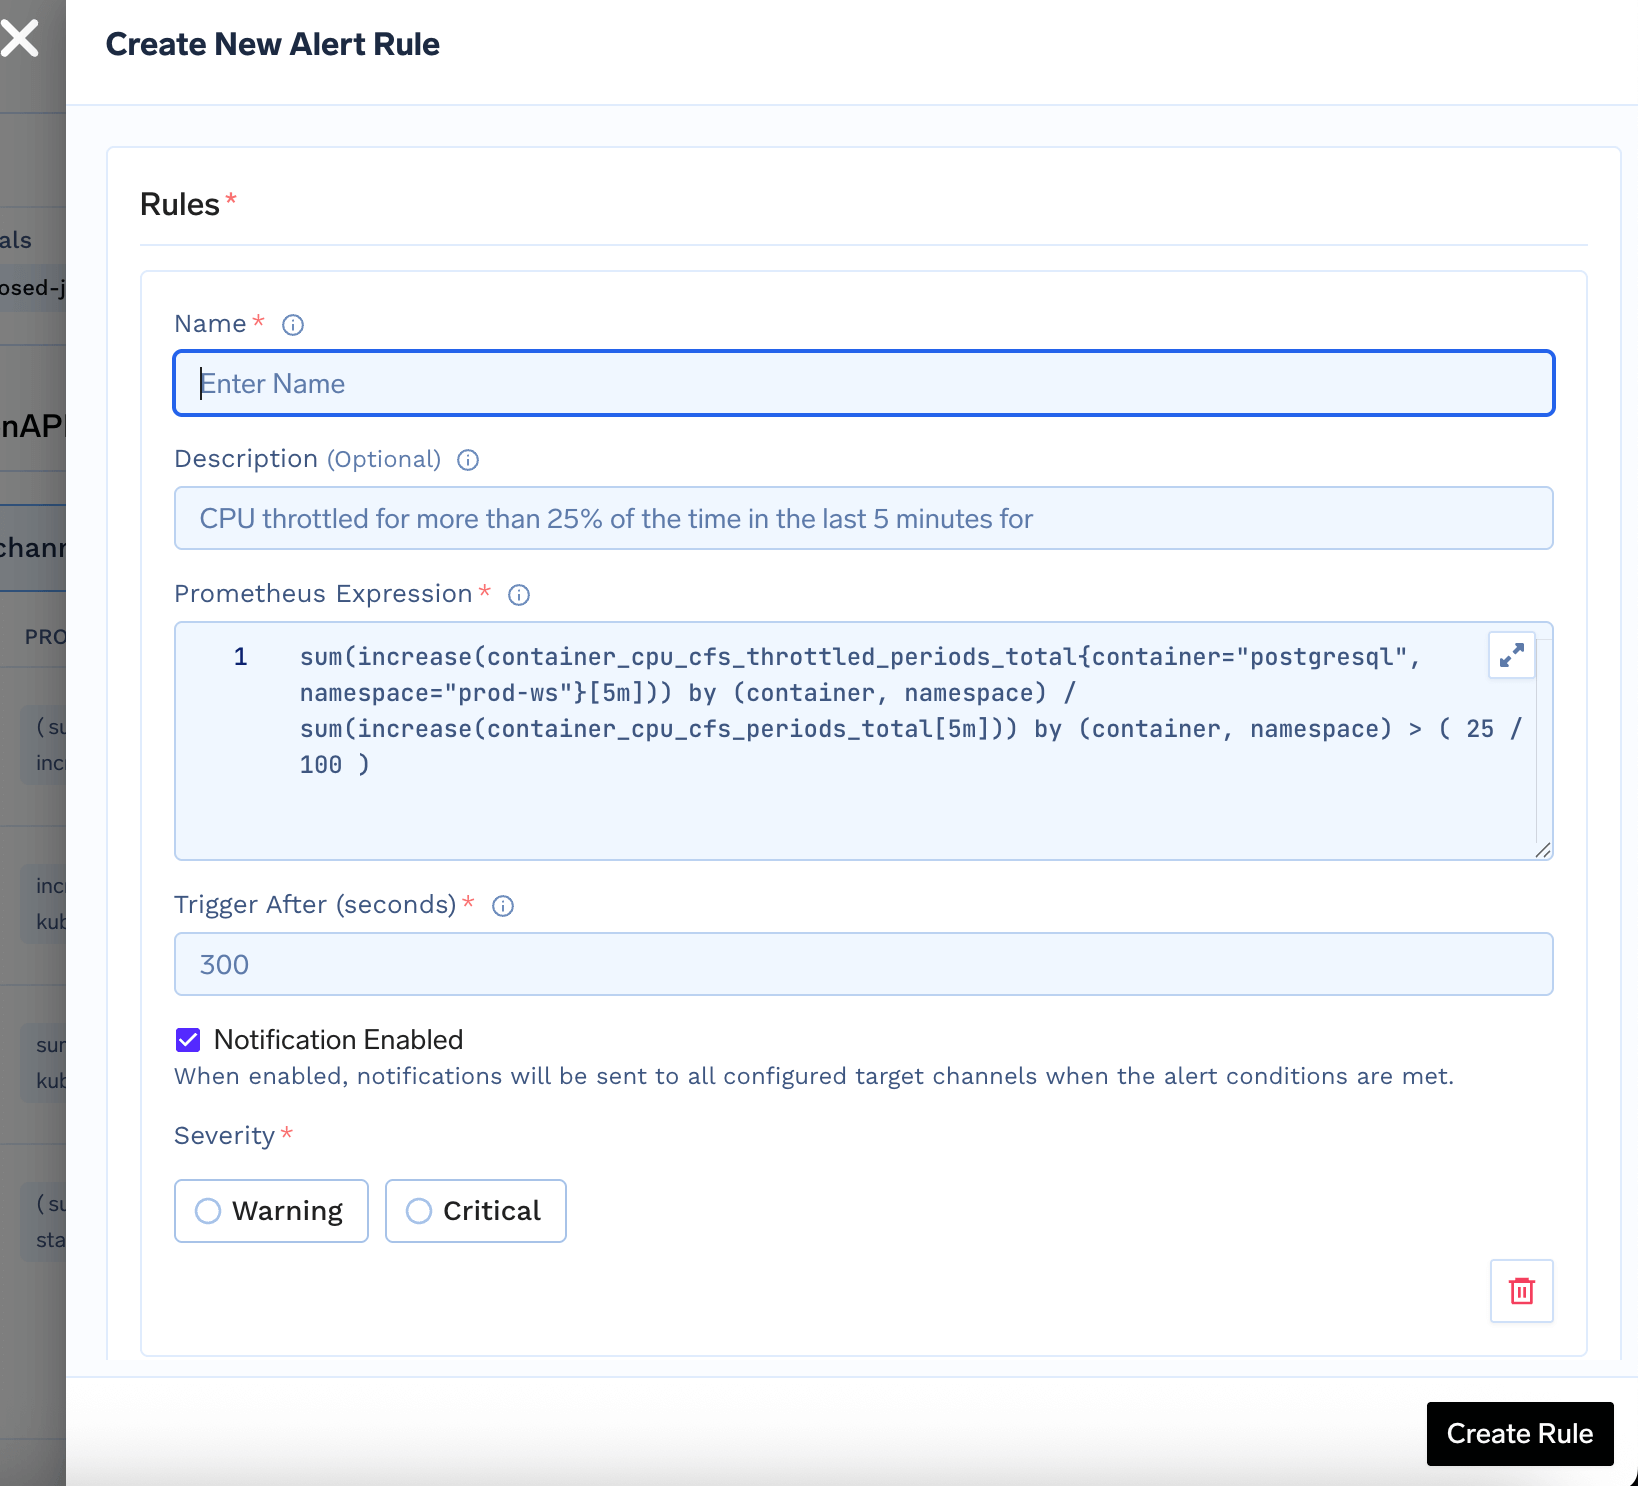
-
Name: A descriptive name for your alert. -
Description: (Optional) Briefly describe what this alert monitors. -
Prometheus Expression: Enter the Prometheus query that defines the alert condition. For example:This triggers if there are more than 5 non-2xx HTTP responses in 5 minutes for any service. -
Trigger After (seconds): How long the condition must be true before triggering the alert. -
Severity: Choose betweenWarningandCritical. -
Notification Enabled: Enable or disable notifications for this rule.
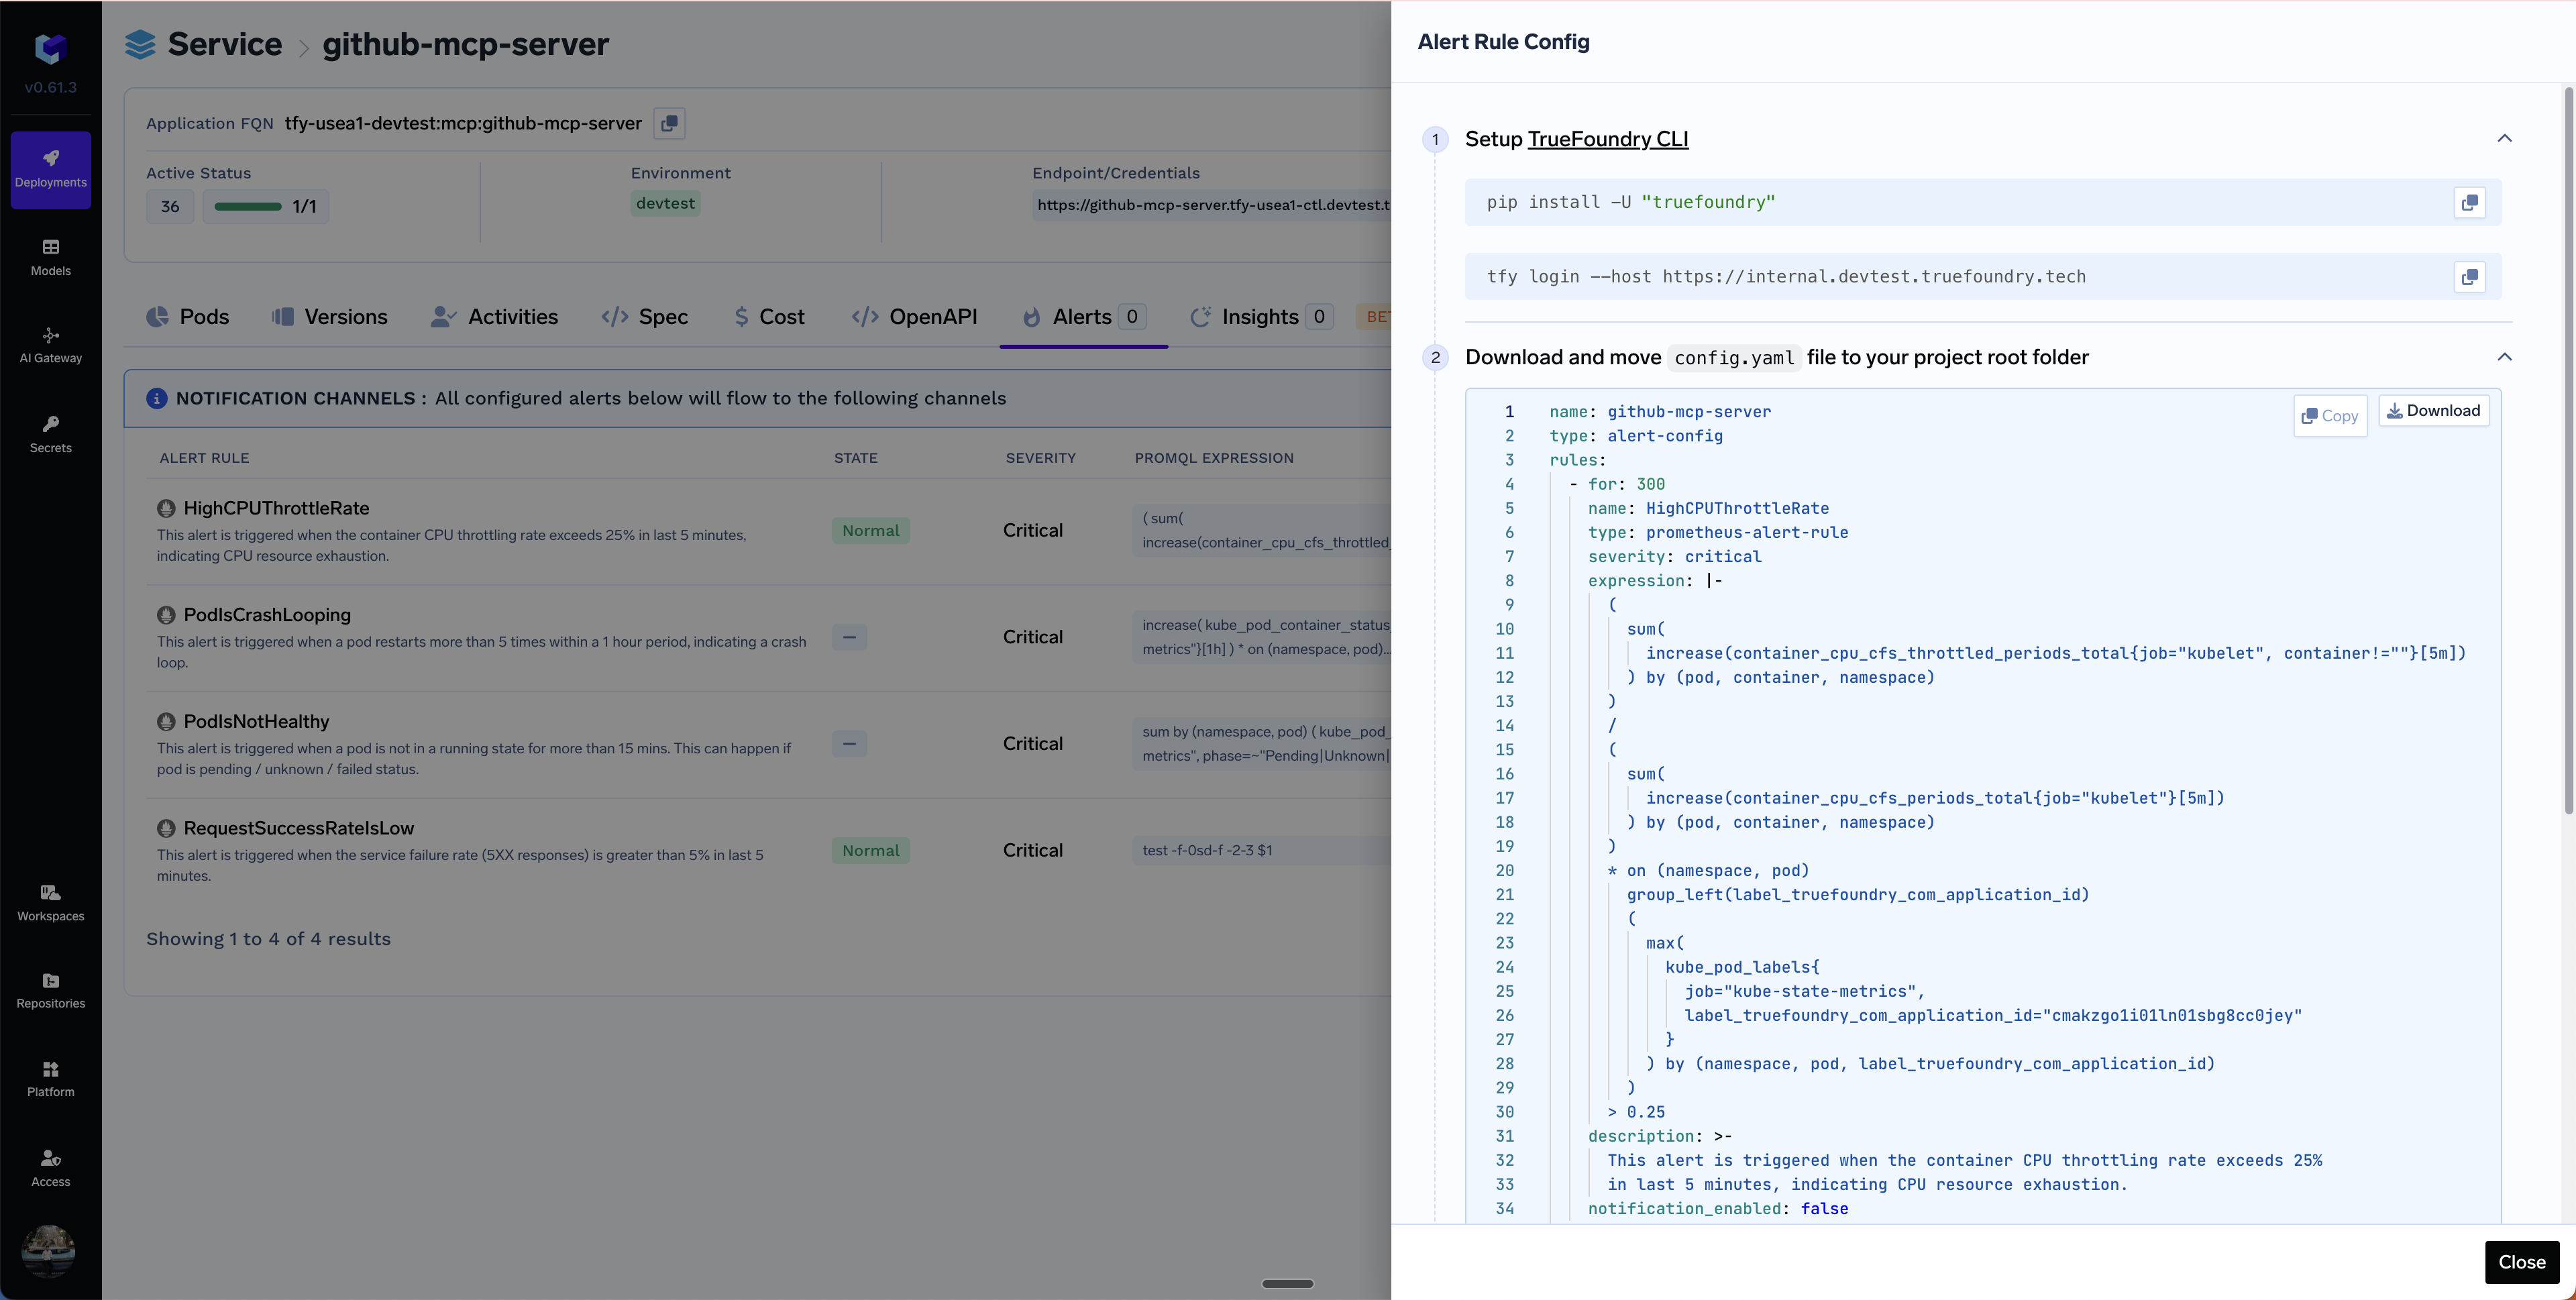
Applying AlertRules via YAML in GitOps
You can apply AlertRules via YAML in GitOps. You can copy the YAML from the Code icon in the Alerts page.