- If one replica goes down because of any reason, the entire service goes down. Having 2-3 replicas at minimum helps provide more fault-tolerance.
- A single replica might not be able to take all of the incoming traffic and hence cause client side errors.
Setting Fixed Number of Replicas
This can be a good choice if the incoming traffic remains constant and we have a good idea of the number of replicas needed. To set the replicas using the UI, you can follow the steps below:Enable Autoscaling
When the traffic or resource usage of the service is not constant, we ideally want the number of replicas to go up and down based on the incoming traffic. We need to define the minimum and maximum number of replicas in this case and the autoscaling strategy will decide what should be the number of replicas between the min and max replicas. We can enable autoscaling based on the following parameters:- CPU Usage: If the application’s cpu usage goes up when traffic increases, this can be a good parameter to autoscale on. For e.g., let’s say your application (one replica) consumes 0.3 vCPU on steady state - however, as traffic goes up, the CPU usage starts increasing to a max of 1 CPU. In this case, setting autoscaling to trigger when CPU usage is greater than 0.6 can be a good idea.
- Requests Per Second (RPS): This is the easiest to reason about and calculate. We can benchmark our service to decide how many requests per second can be served by one replica using benchmarking tools like Locust. Let’s say one replica can serve 10 requests per second without an degradation in quality (increase in latency or errors). If we expect the traffic to vary from 50 requests per second to 200 requests per second, we can set the minimum replicas to 5, maximum to 20 and set the rps autoscaling metric to 10.
- Time Based Autoscaling: This can be useful if the traffic patterns shift based on timezones, or you want to shut down dev workloads during non-office hours. For e.g, if you want to scale up replicas only between Monday to Friday 9AM to 9PM, you can set time based scheduling with cron start schedule as
0 9 * * 1-5and end schedule as0 21 * * 1-5.
Configure Autoscaling for an Application
The key things to configure for autoscaling are:
- Min Replicas: The minimum number of replicas to scale down to.
- Max Replicas: The maximum number of replicas to scale up to.
- Autoscaling Metric: The metric to autoscale on.
- Autoscaling Value: The value of the metric to autoscale on.
- Polling Interval (Advanced): This defines the time interval at which the metrics are checked to decide if the service needs to be scaled up/down. The default values is 30 seconds. You can make it lower to 10 seconds in case you want to scale more quickly.
Getting the autoscaling metric and value can be tricky and requires us to benchmark the service.
Read below on how to figure this out.
How to decide the autoscaling metric value
If you are using CPU as the autoscaling metric, it is usually a safe bet to autoscale when CPU usage is greater than 70%. You can further tune this value based on your application’s behaviour like time to startup (We might want to scale up at a lower cpu percentage like 60% in this case) or reliability requirements. If you are using time as the autoscaling metric, you can derive the cron expression of the start and end times to scale up and down. For setting up requests/second as the autoscaling metric, we need to benchmark the service to decide the number of requests per second that can be served by one replica. Benchmarking in general is useful because of the following reasons:- Determining the service’s capacity in terms of handling requests per second.
- Assessing the threshold of concurrent requests, indicating the number of users the service can accommodate simultaneously.
- Analyzing how latency fluctuates with increasing traffic volume.
How to benchmark a service
There are multiple tools to benchmark your service like Locust, Gatling, K6, hey. This guide will outline how to use Locust to benchmark your service - since its quite easy to setup, use and is widely used by datascientists and engineers. You can follow the steps mentioned below:1
Install Locust
2
Write the Locust File
We need to write a simple class which implements a function to send requests to your deployed service. You will need to replaceIn the code above, we are sending a POST request to the deployed service with the payload mentioned above.You can read this doc to understand more about writing a locust file.
locust_benchmark.py
If your service is deployed at https://service-name.example.com and you want to benchmark the API at
https://<service-name>.example.com/path/to/your/endpoint, you only need to mention /path/to/your/endpoint in the code above.3
Run the Locust File locally
https://service-name.example.com/ in the example above.4
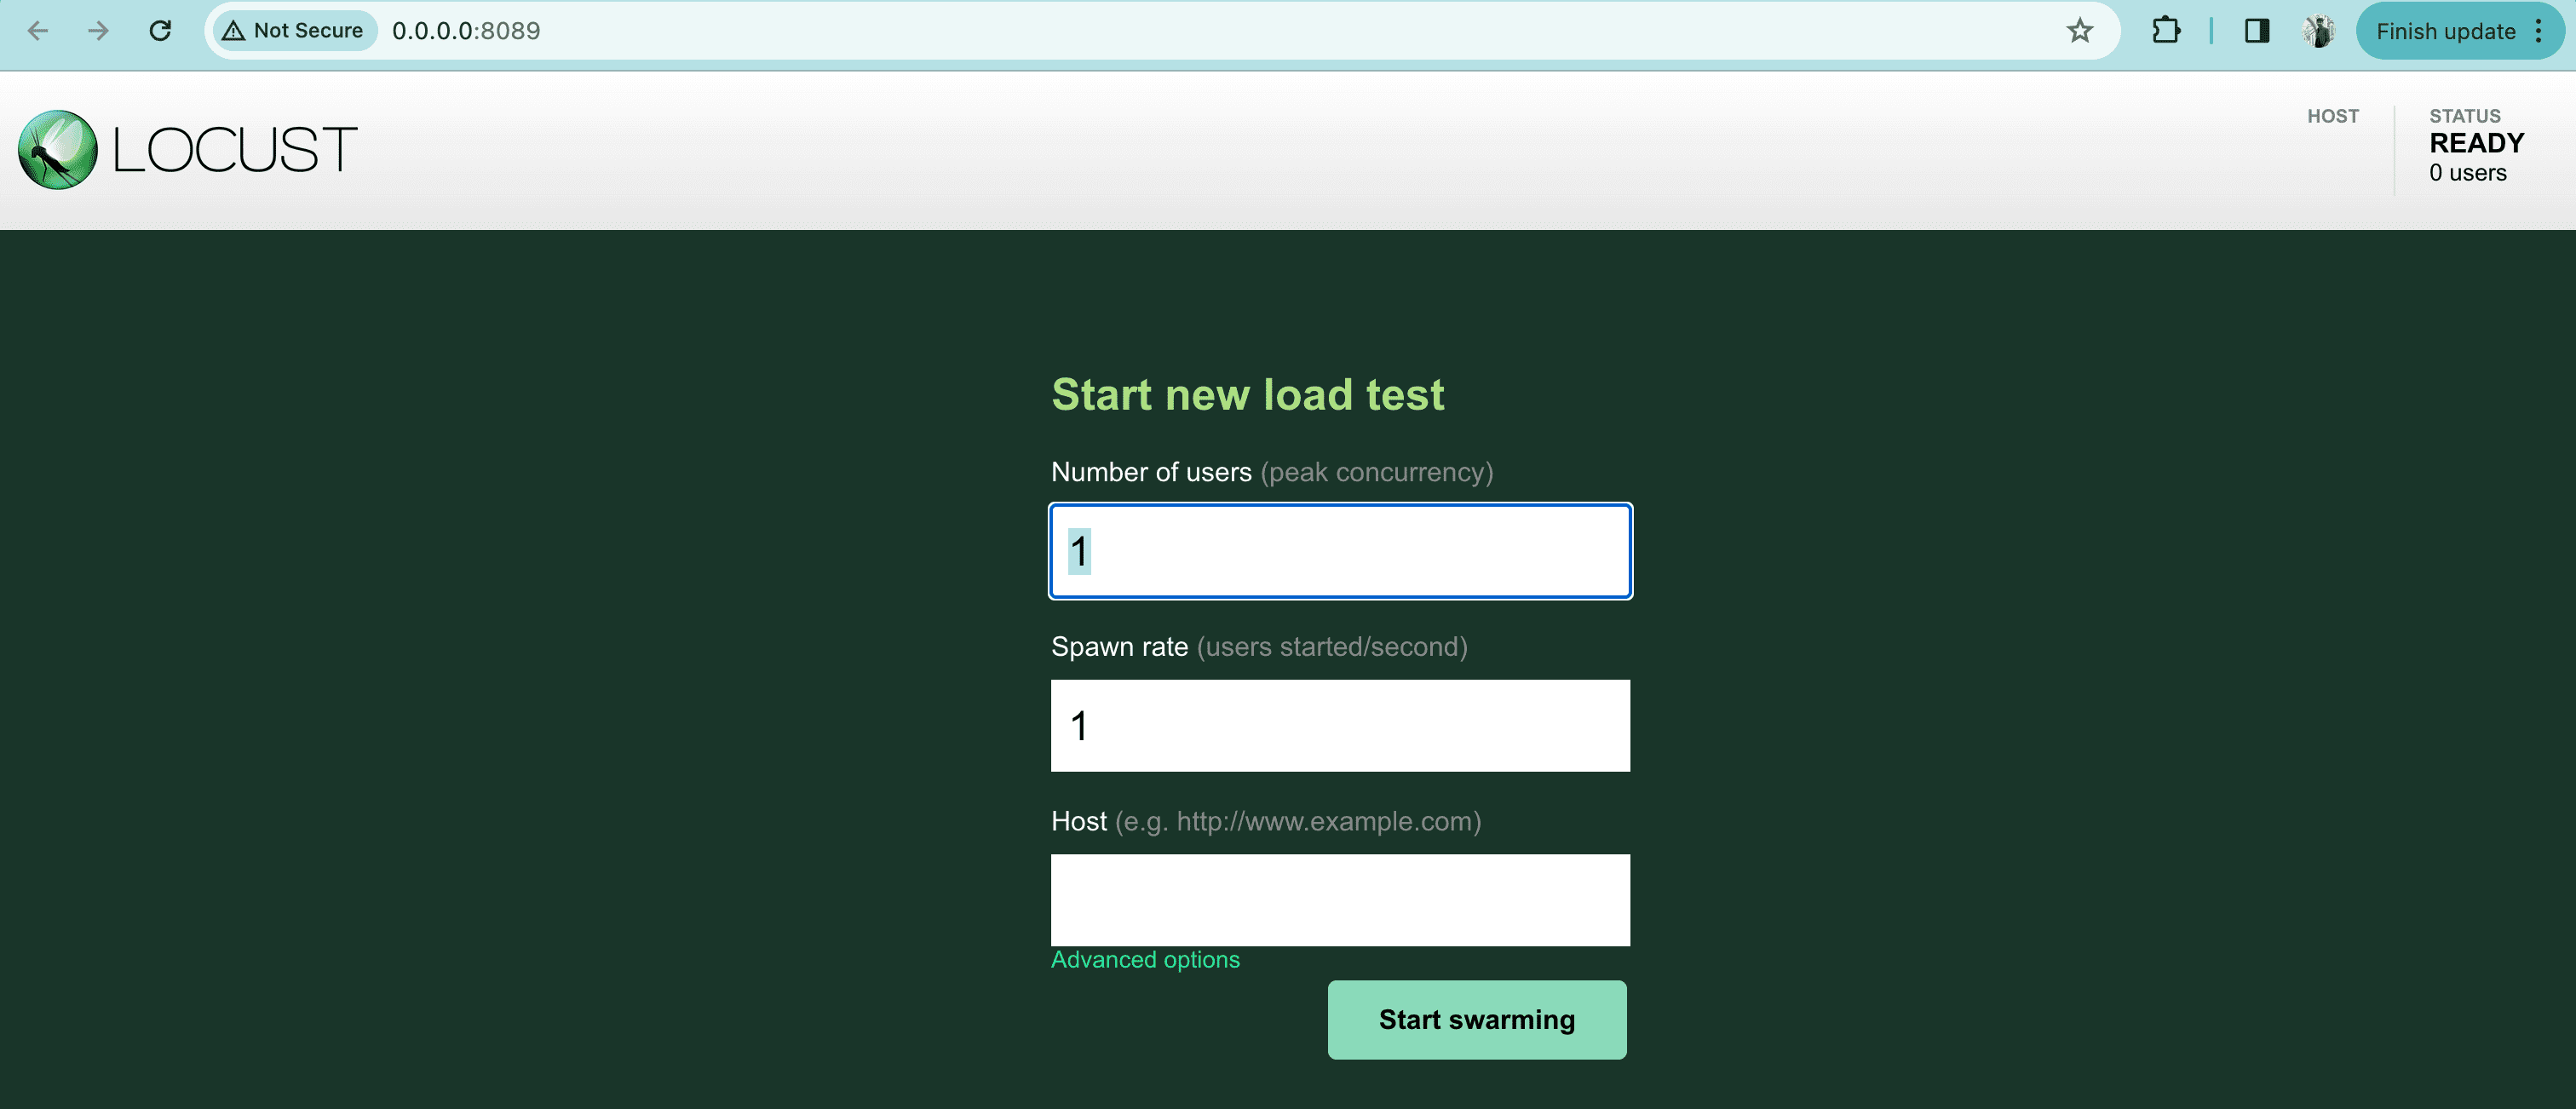
Send requests to the service to benchmark
Once you paste the link, you can click on “Start Swarming” after setting the following parameters: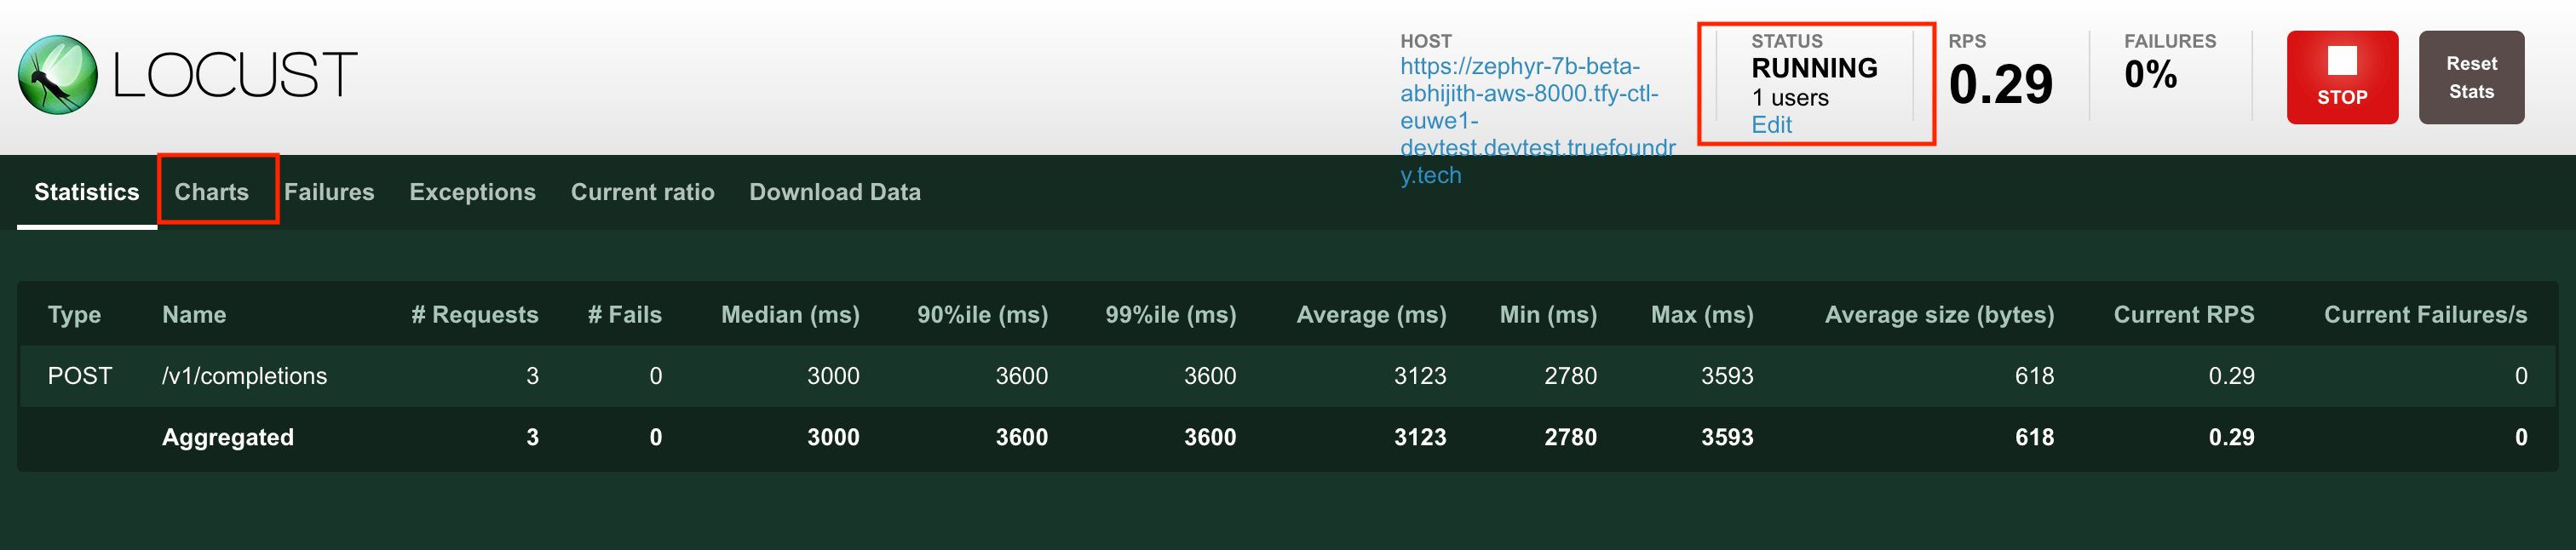
- Number of Users: Number of concurrent users that will bombard your service
- Spawn Rate: If multiple users are selected, the rate at which it will create new users (this can be 1 by default)
5
Deploy the locust service on Truefoundry
While you can benchmark your service by running Locust locally, its usually recommended to deploy the locust service on the same cluster in which your service is deployed. This helps in reducing the latency from the locust code to your service and helps provide more accurate results.You can deploy your locust code as a service on truefoundry. To deploy, place the following 2 files in a directory (Let’s call it Once you have this ready, please go to TrueFoundry UI and follow the following steps: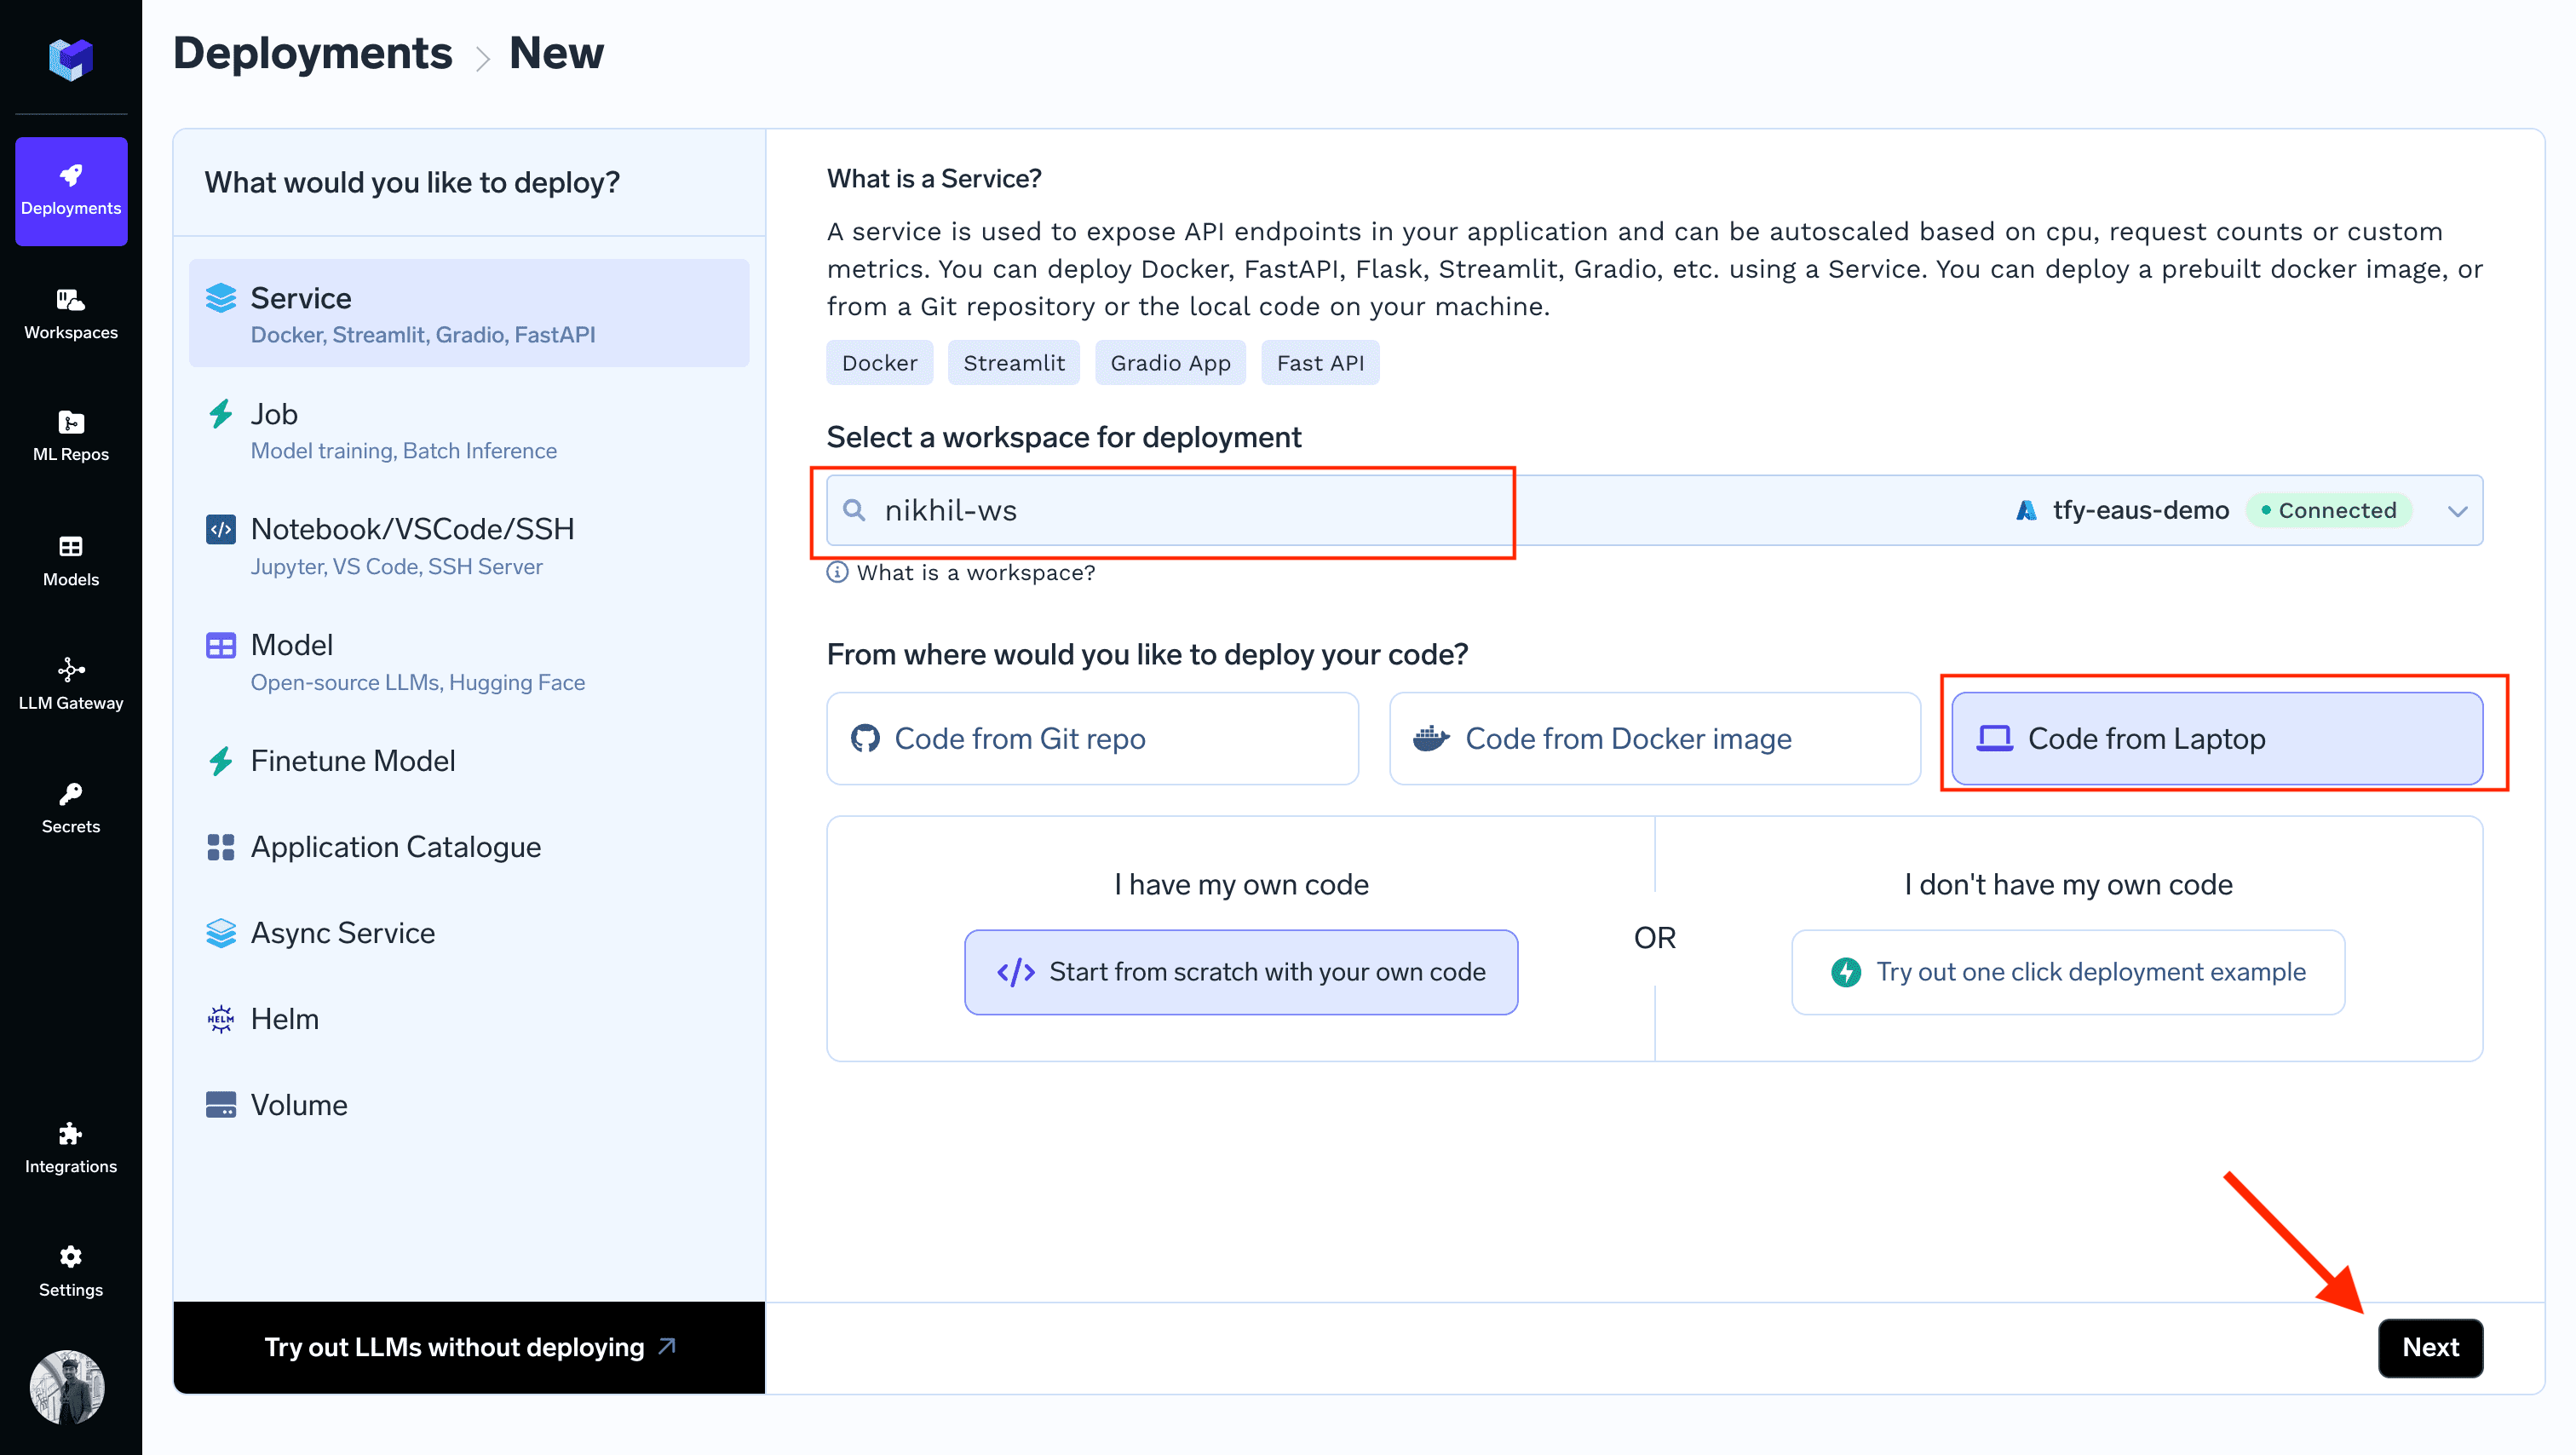
The latencies depicted in Locust while running on your local machine might not be accurate since its dependent on your internet speed. Moving it to the cluster helps provide a more stable and fast network.
locust_service).locust_benchmark.py(shown above)requirements.txt
- Click on
New Deploymentbutton on top right of your screen. - Select your workspace
- Select
Code from Laptop - Click on
Next - Follow the guide from the UI
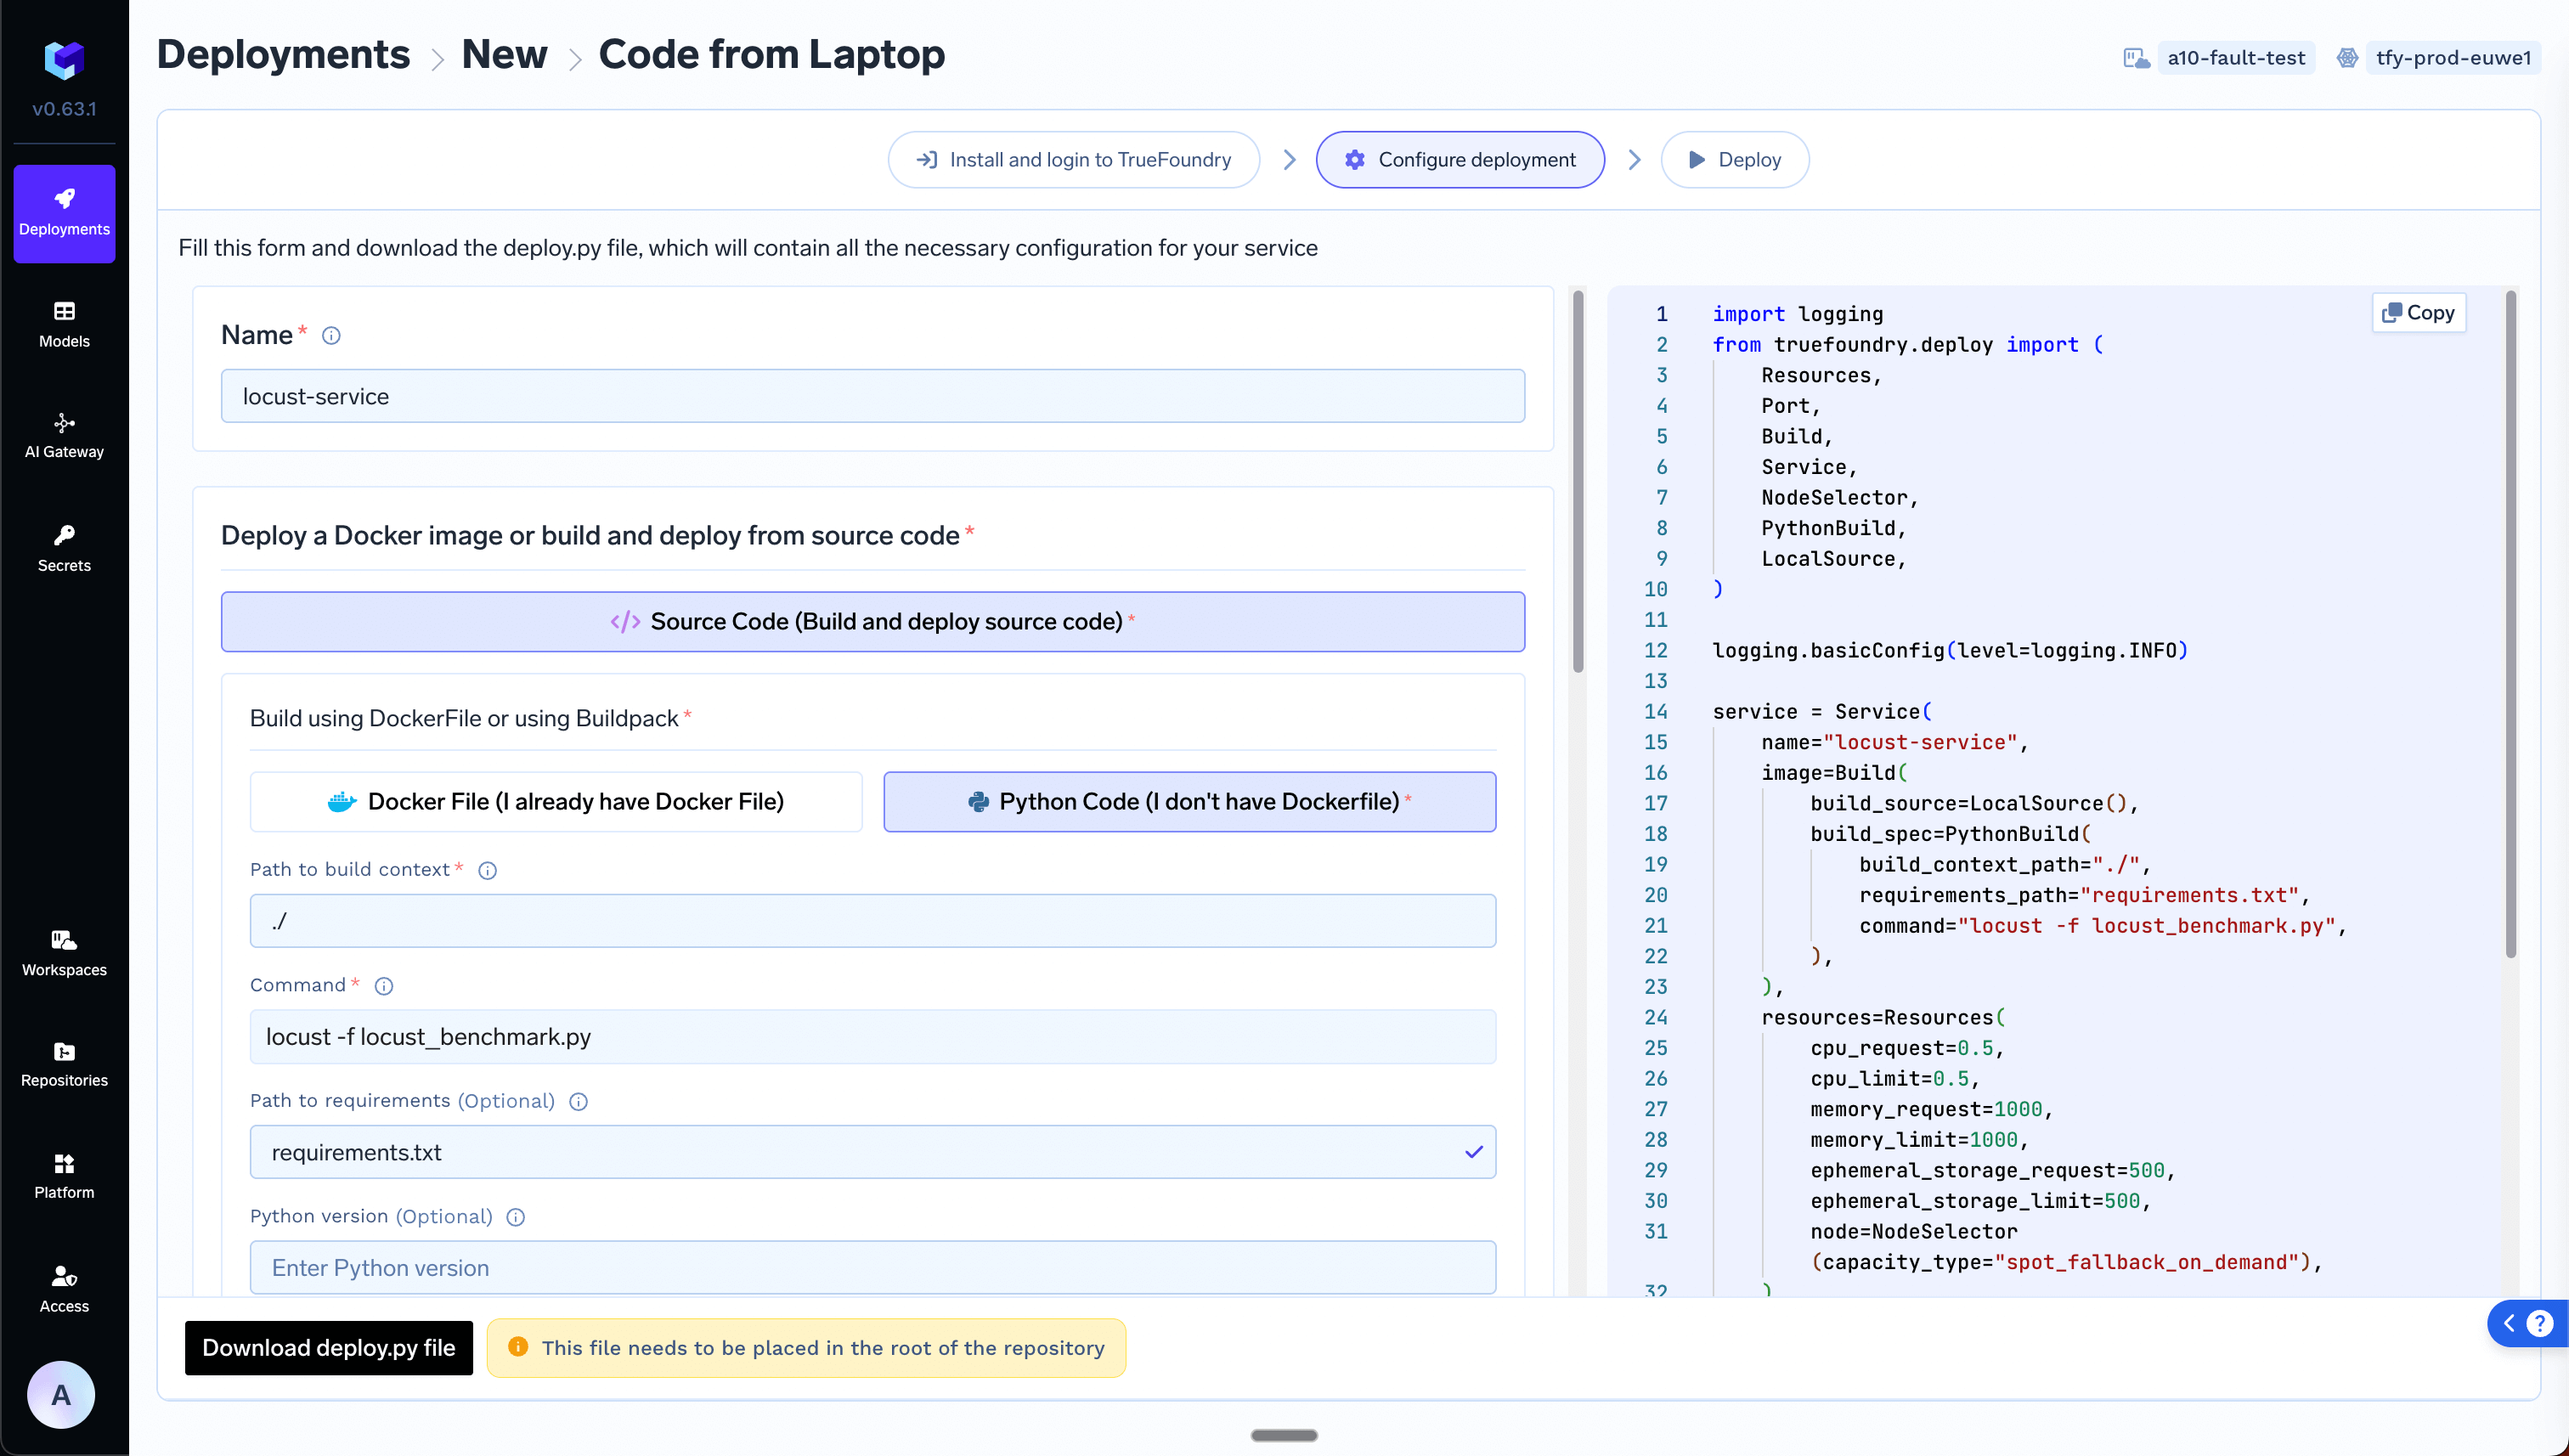
- In the deployment form, name the service as
locust-service, choosePython Code (I don't have Dockerfile)option and set the command aslocust -f locust_benchmark.py.
6
Benchmark your service to get the autoscaling metric value
Once the deployment of the locust service completes, you can open the endpoint of the locust service and see the same UI that we saw above while running it locally. To benchmark your service (let’s call it my-service), follow the guidelines below: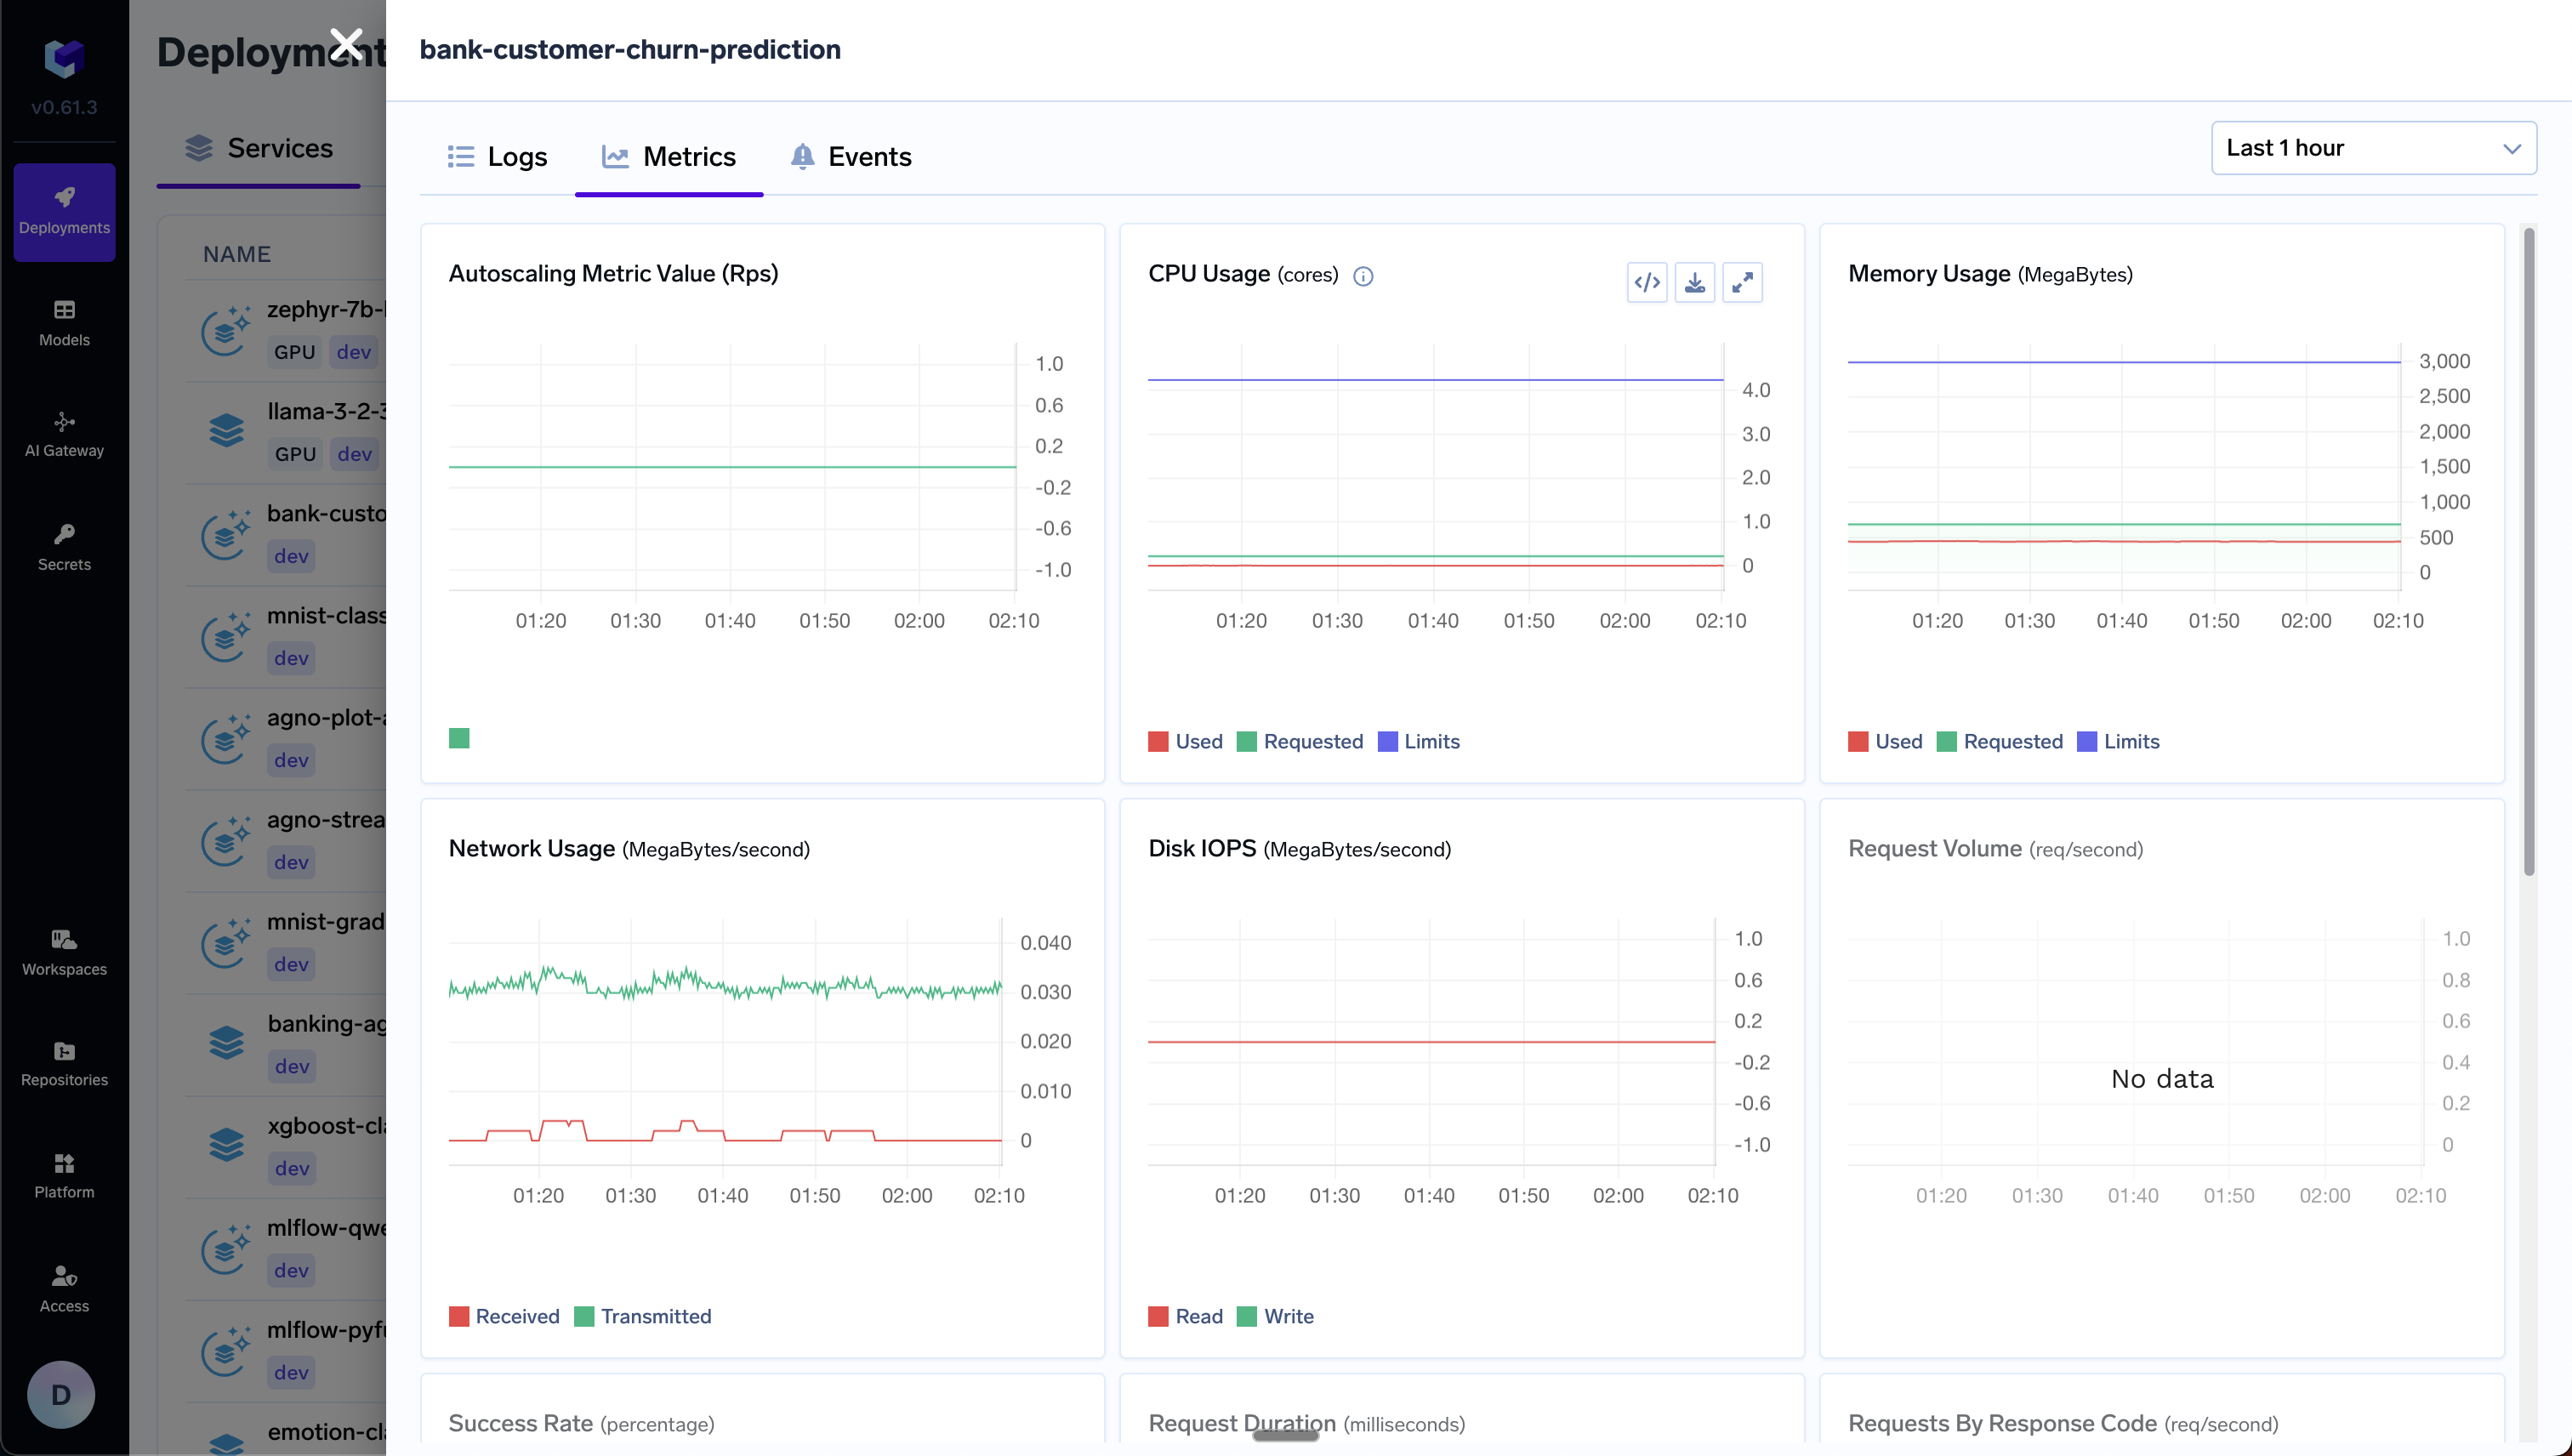
- Run 1 replica of service-a. Its important to benchmark with 1 replica to understand how many requests per second can be served by 1 replica.
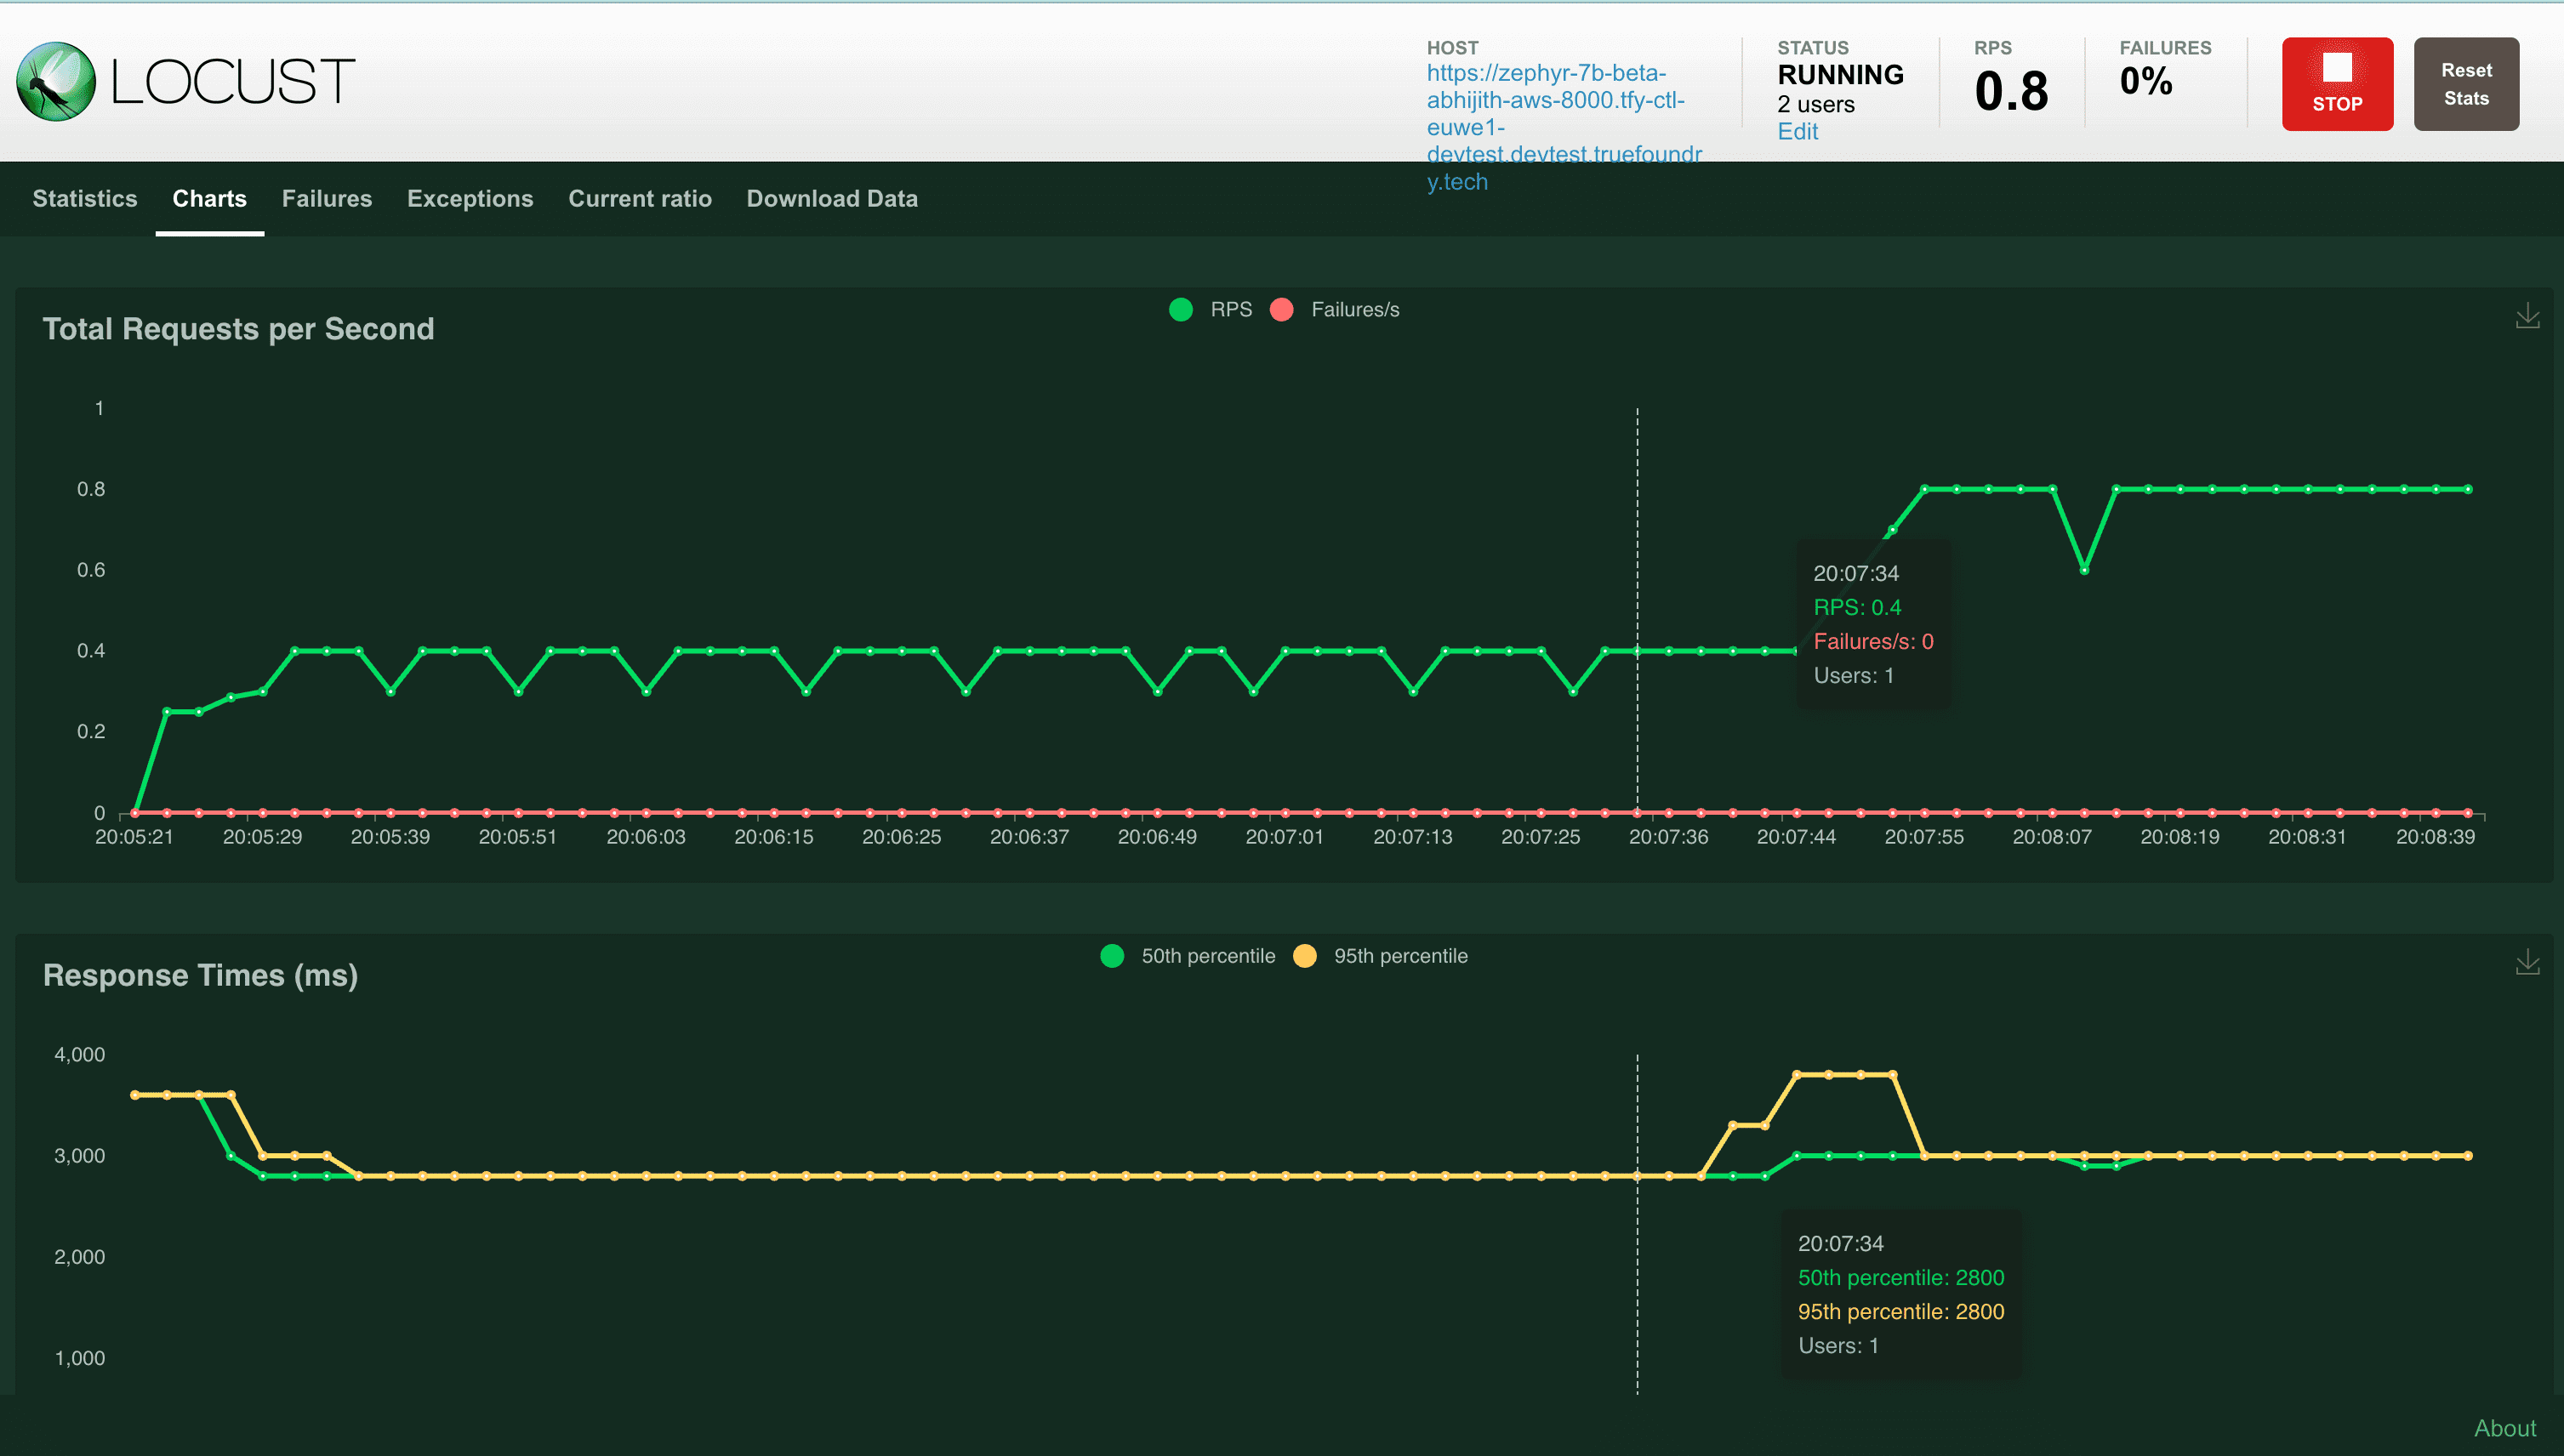
- Start with a few users (1-10) and gradually keep increasing it.
- We should increase the number of users till either the latency starts increasing beyond our point of tolerance or we start seeing errors from the service.
- Observe the CPU and memory usage of the service at this time from the metrics on Truefoundry portal.
- The CPU usage should be going up as we increase the number of users and hence requests per second.
- We can try increasing the cpu requested if we want per pod to allow it to handle more requests per second. Let’s say we can handle 10 requests per second with 1 CPU. Going more than 10 requests per seconds results in higher latencies. In this case we can set the autoscaling metric to requests per second and the value to somewhere around 7-8 to have some buffer in each replica.
- Set the autoscaling criteria and redeploy the service. Now if you increase the number of users in Locust, you should be able to see the pods autoscale to multiple replicas and requests per second goes above 10.