Monitor LLM application performance, costs, and usage patterns with the comprehensive Metrics Dashboard
The Metrics Dashboard gives you a complete picture of your LLM application’s health and efficiency. Pinpoint performance bottlenecks, track spending in real-time, and see exactly how your application is being used, all from a single, interactive interface.With the Metrics Dashboard, you can monitor and analyze:
Performance Metrics: Track key latency metrics like Request Latency, Time to First Token (TTFS), and Inter-Token Latency (ITL) with P99, P90, and P50 percentiles.
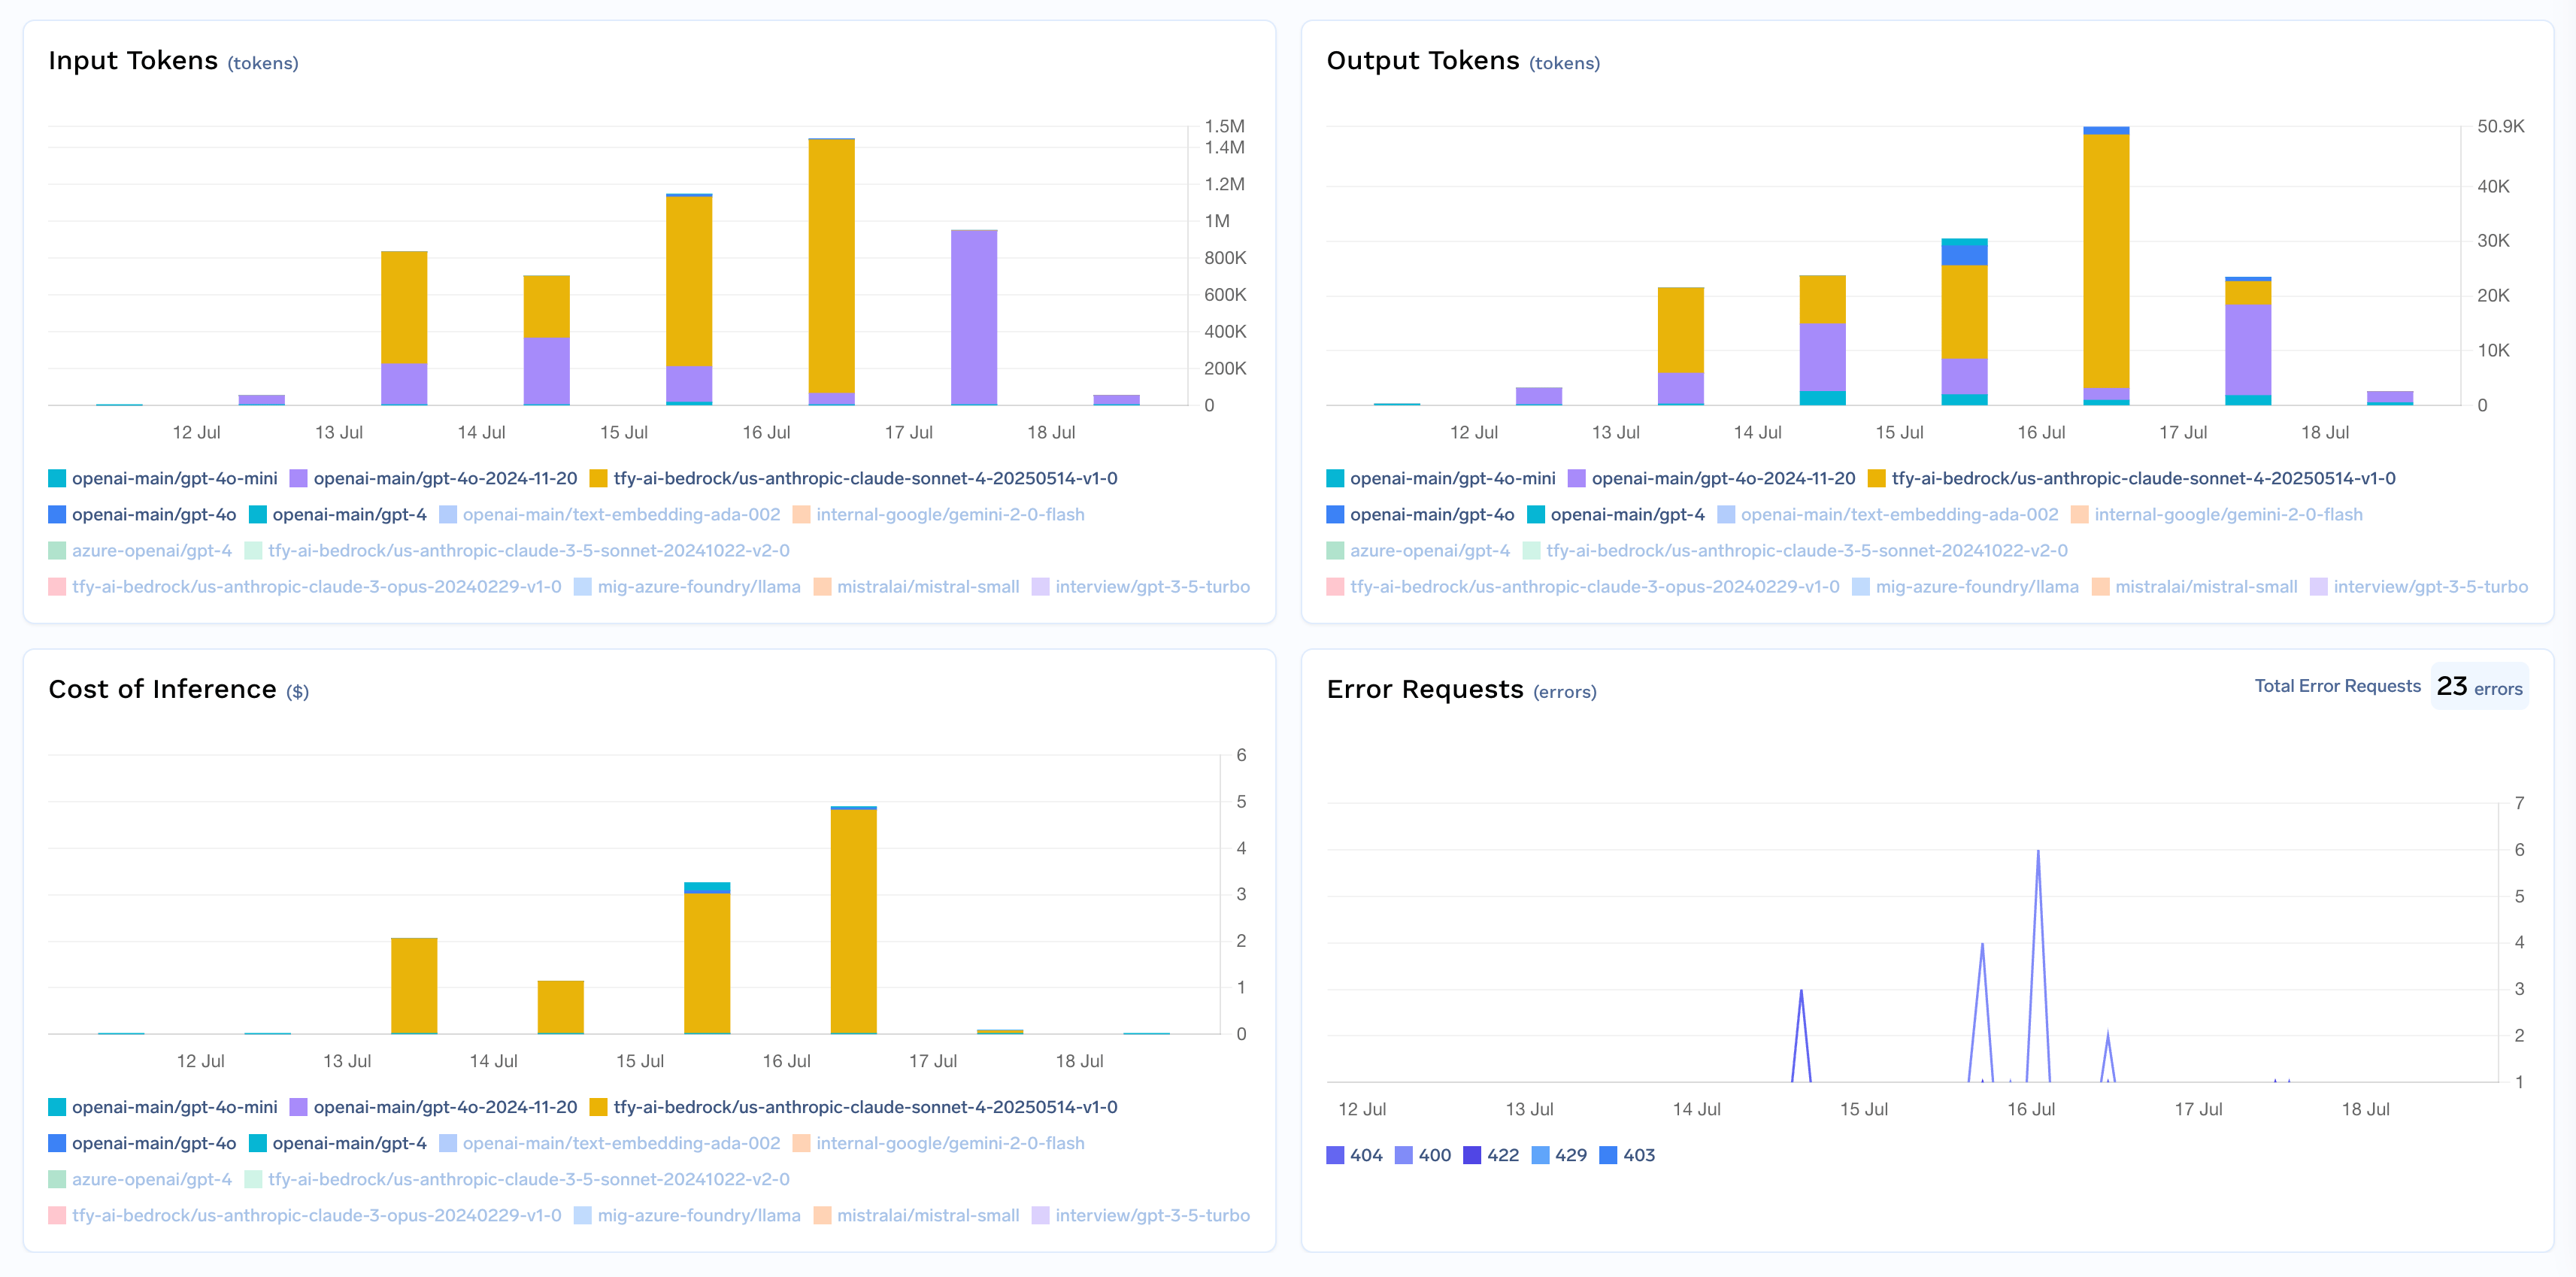
Cost and Token Usage: Gain visibility into your application’s costs with detailed breakdowns of input/output tokens and the associated expenses for each model.
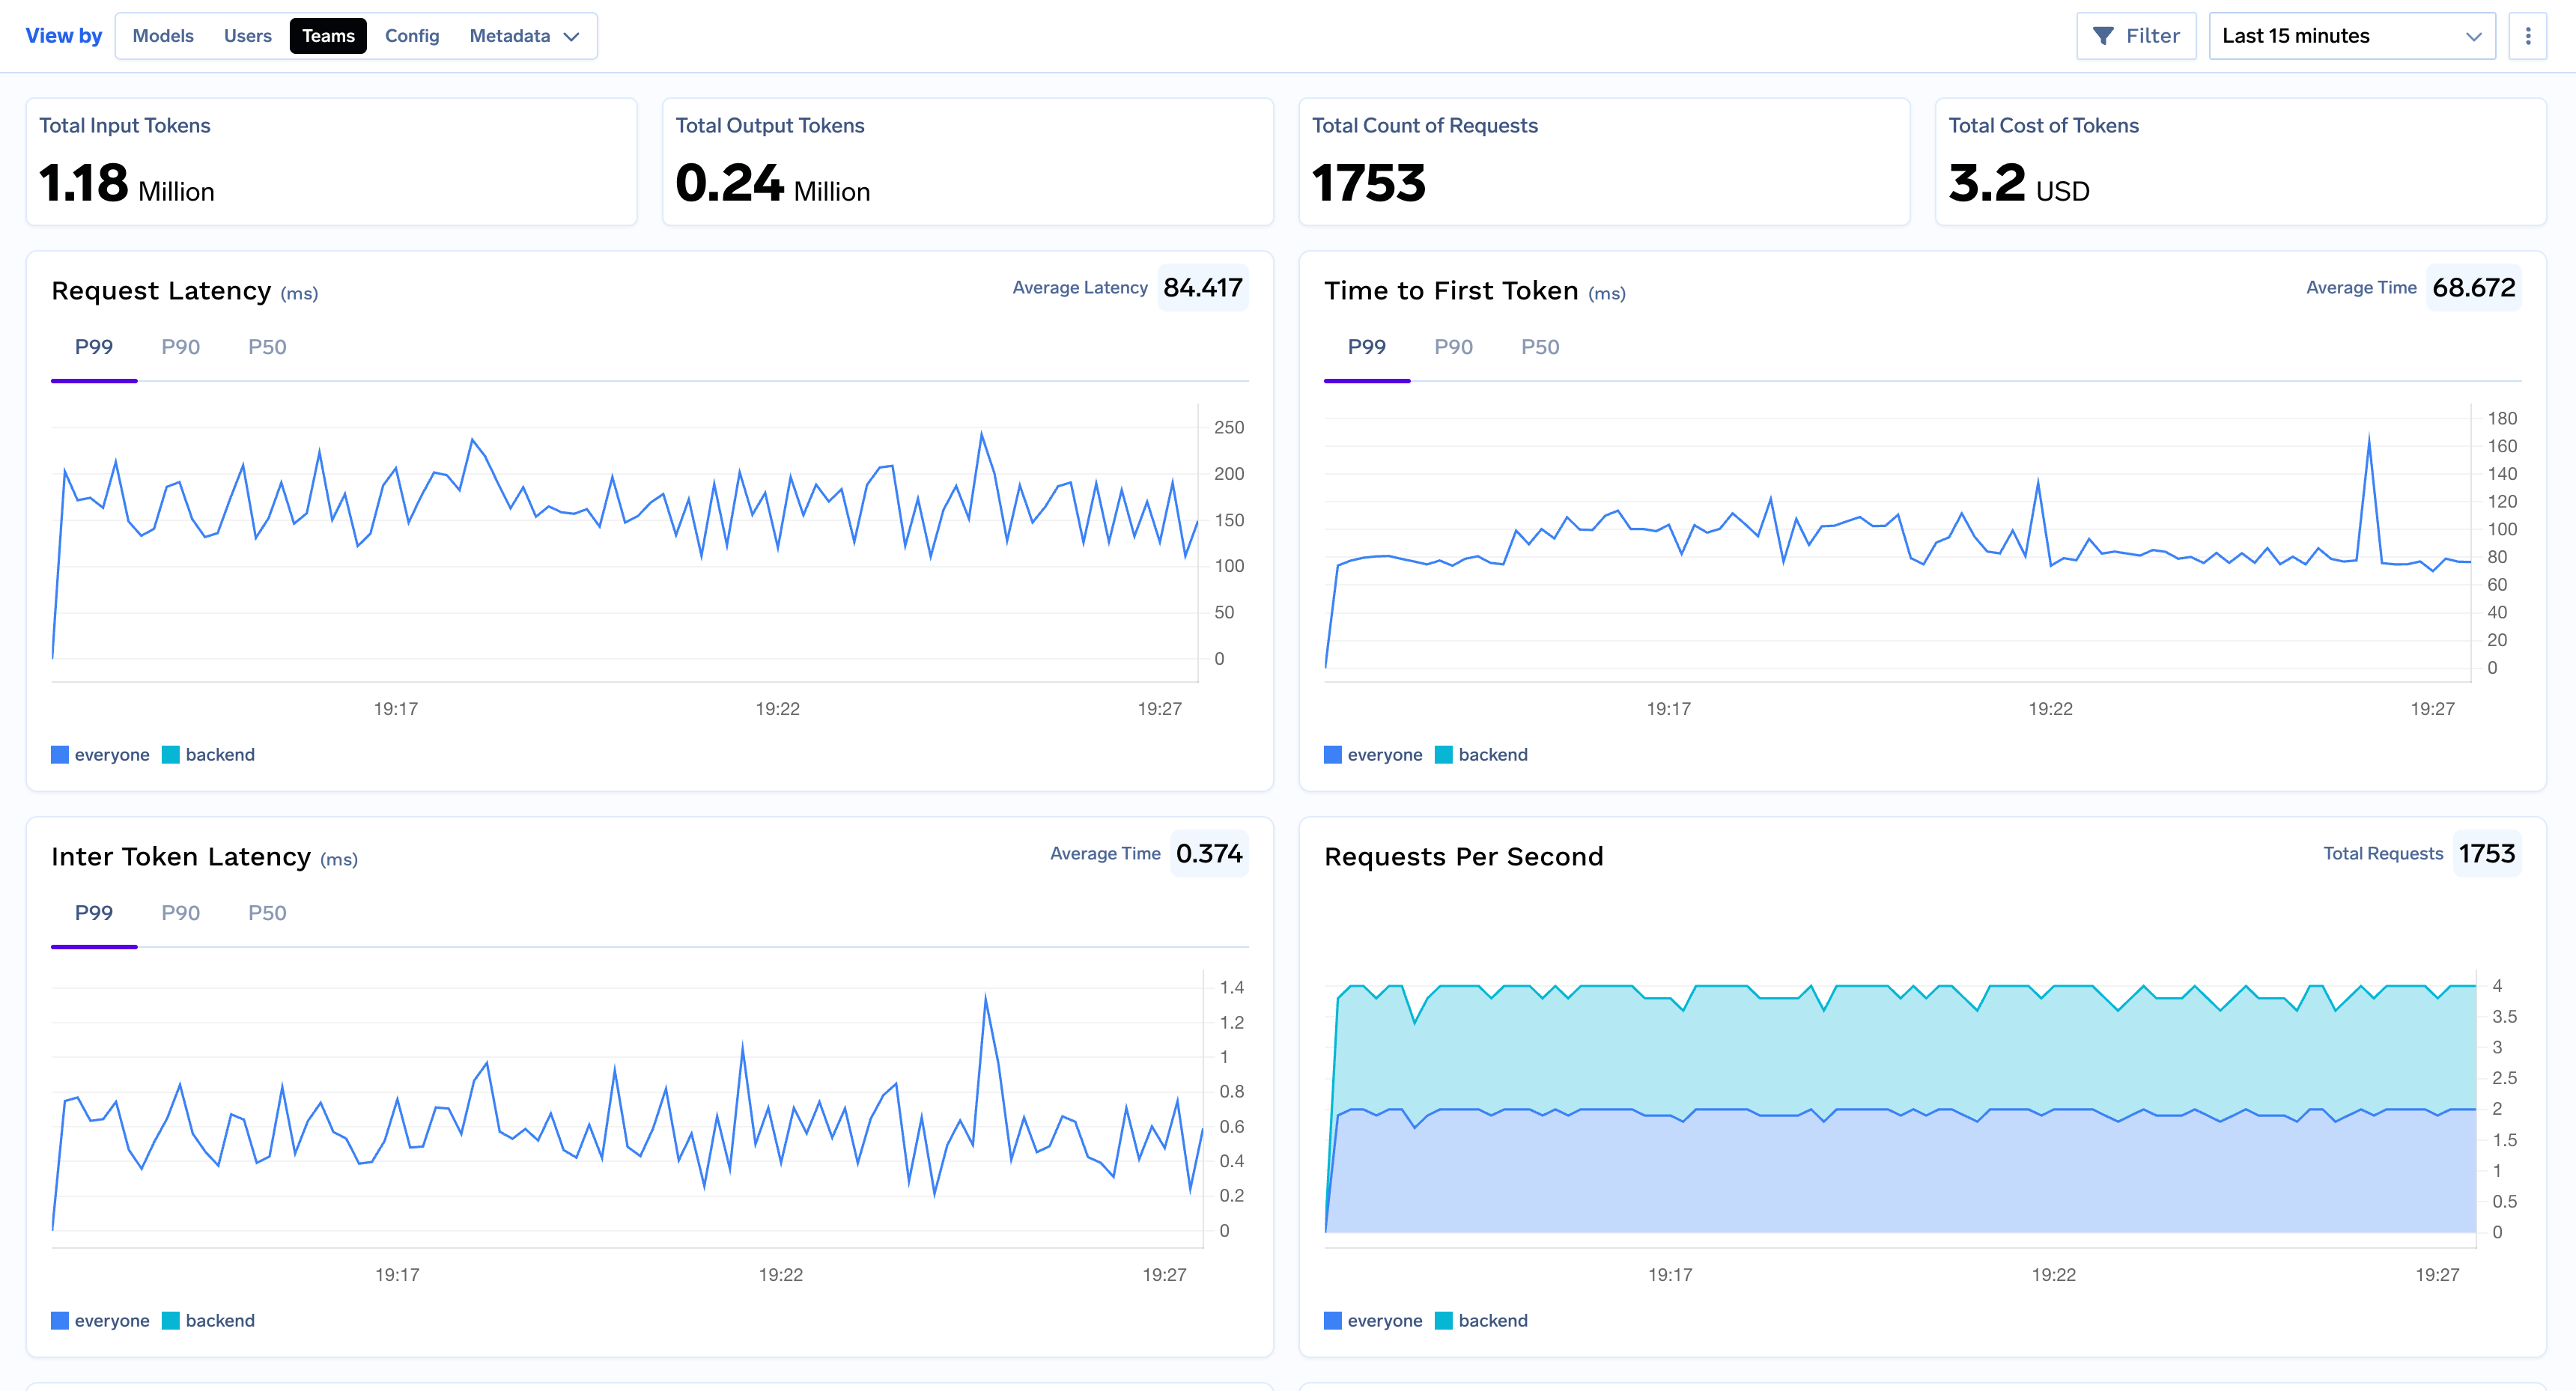
Usage Patterns: Understand how your application is being used with detailed analytics on user activity, model distribution, and team-based usage.
Error Analysis: Quickly identify and diagnose issues with a view of error rates and error code information.
Configuration Impact: Evaluate the effectiveness of your gateway configurations by monitoring how often rate limiting, load balancing, fallbacks, guardrails, and budget limits are triggered.
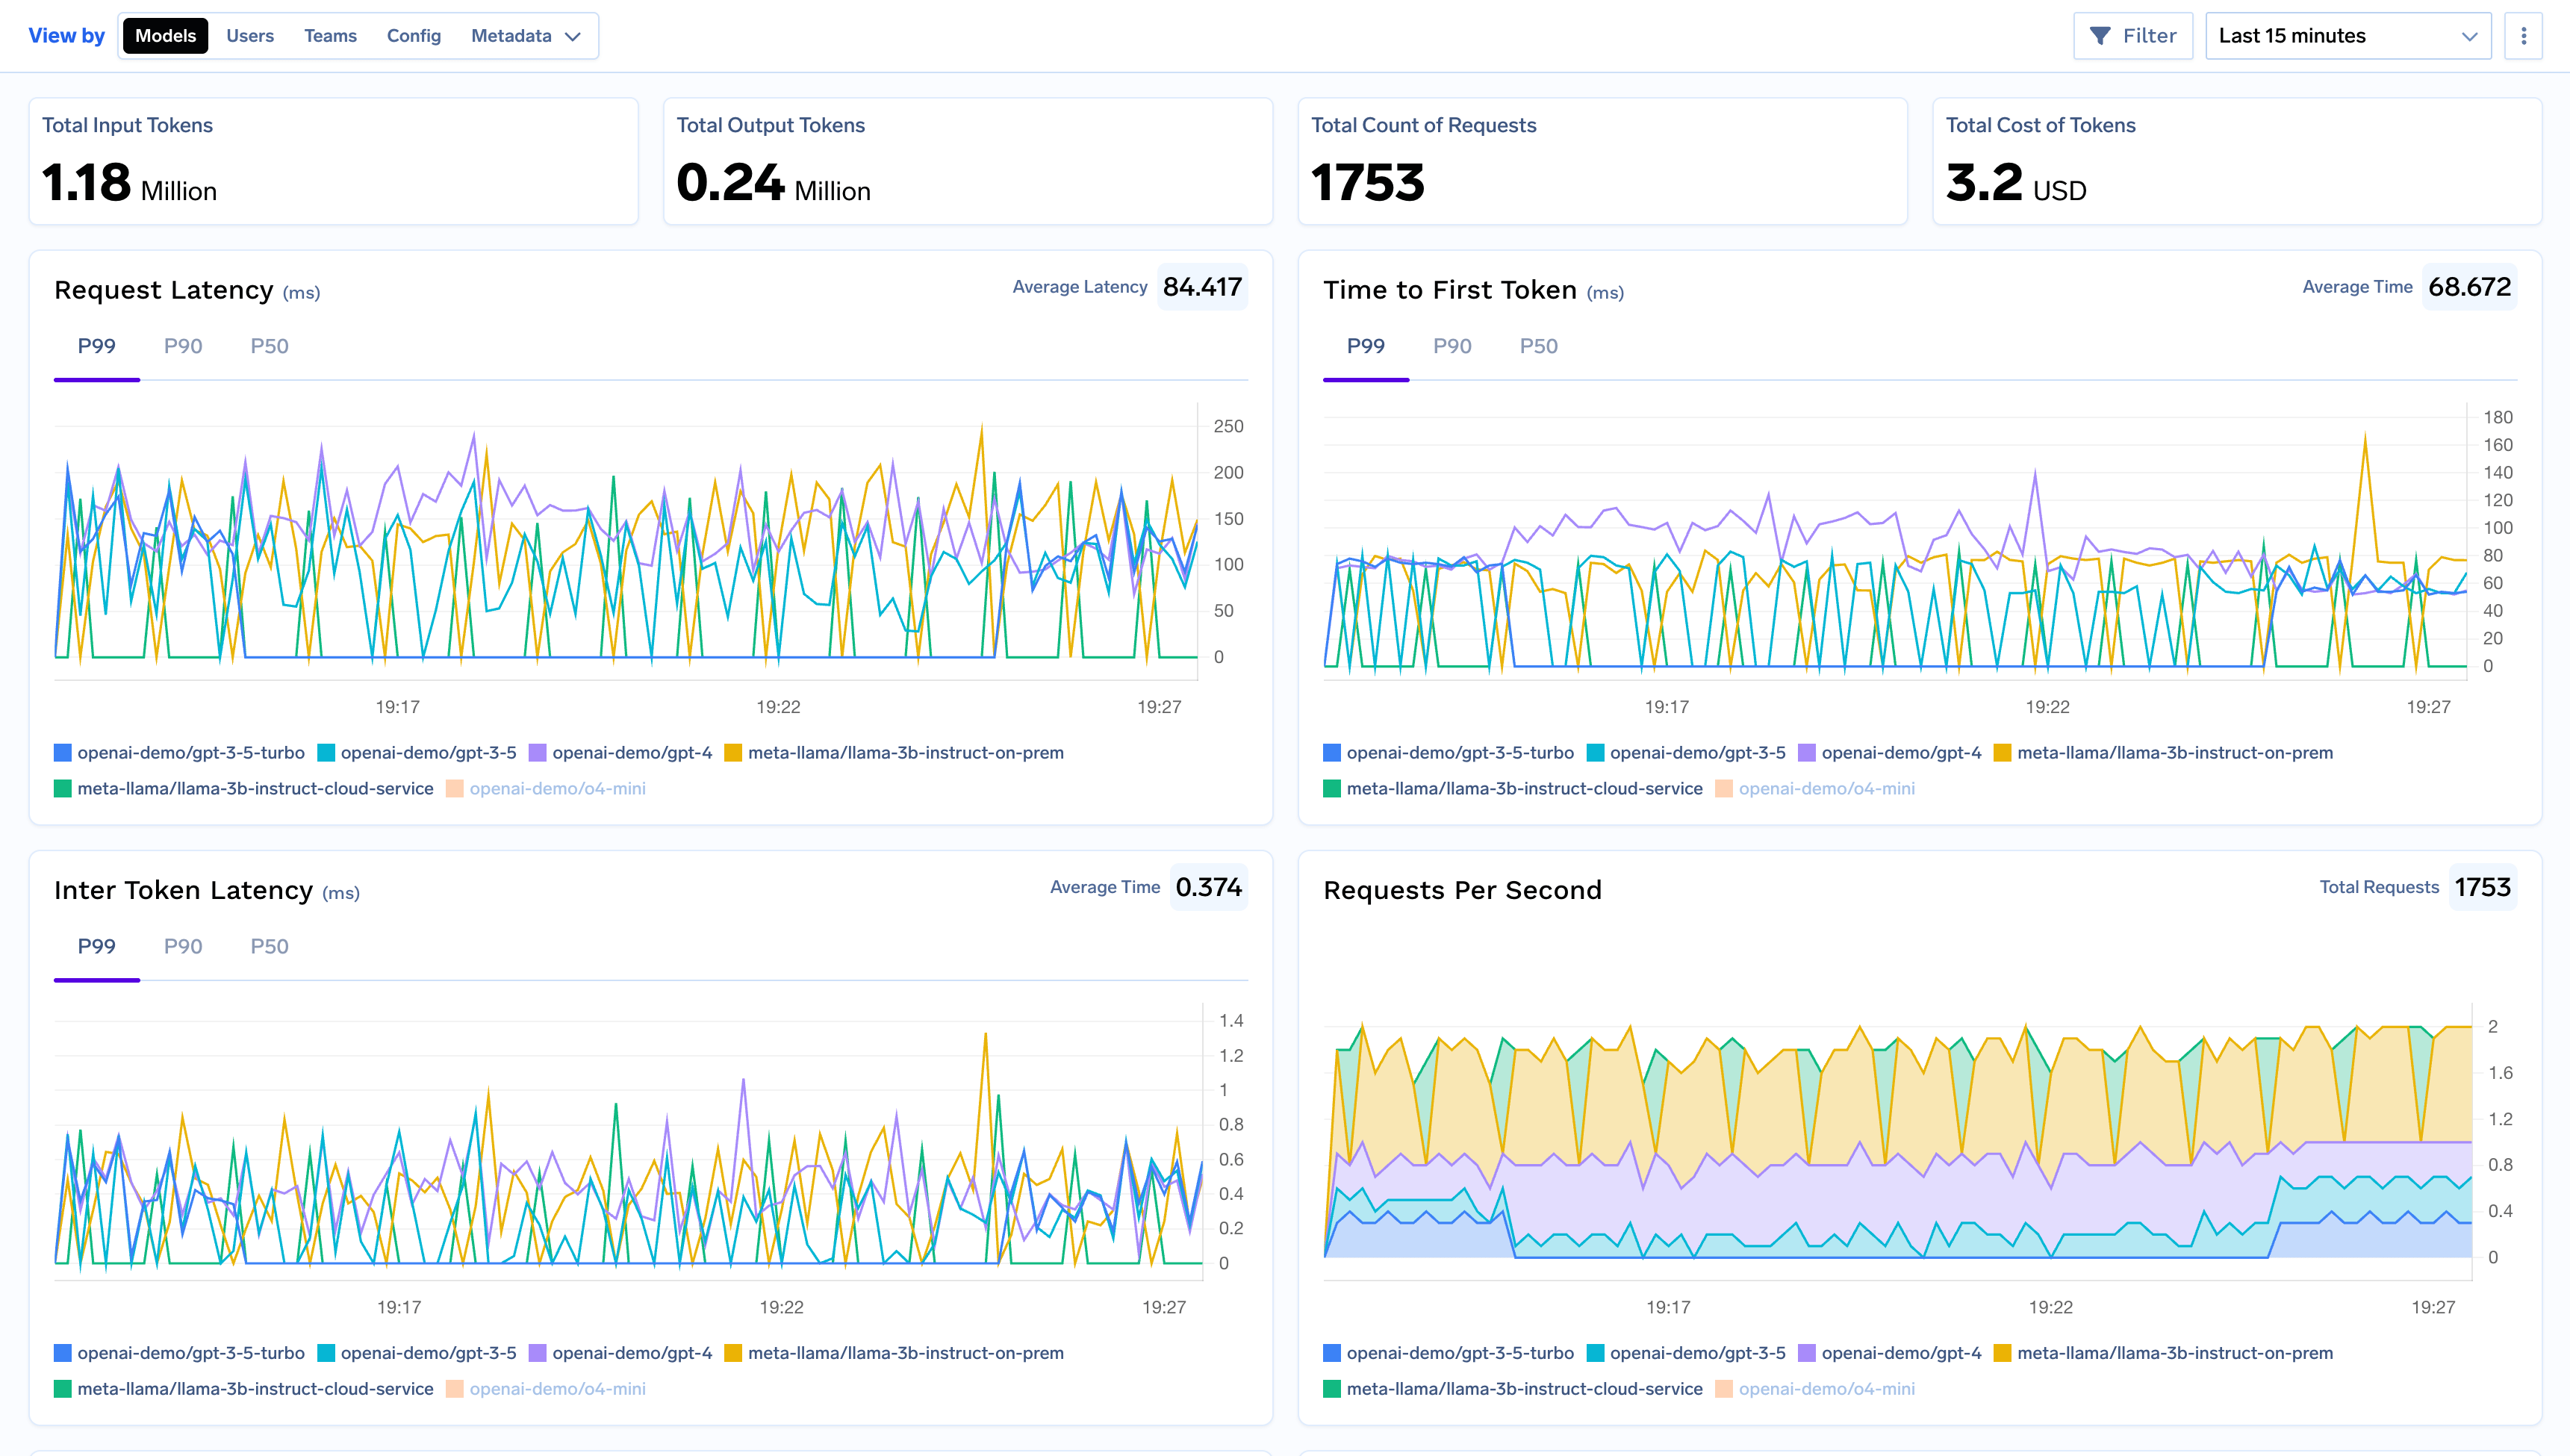
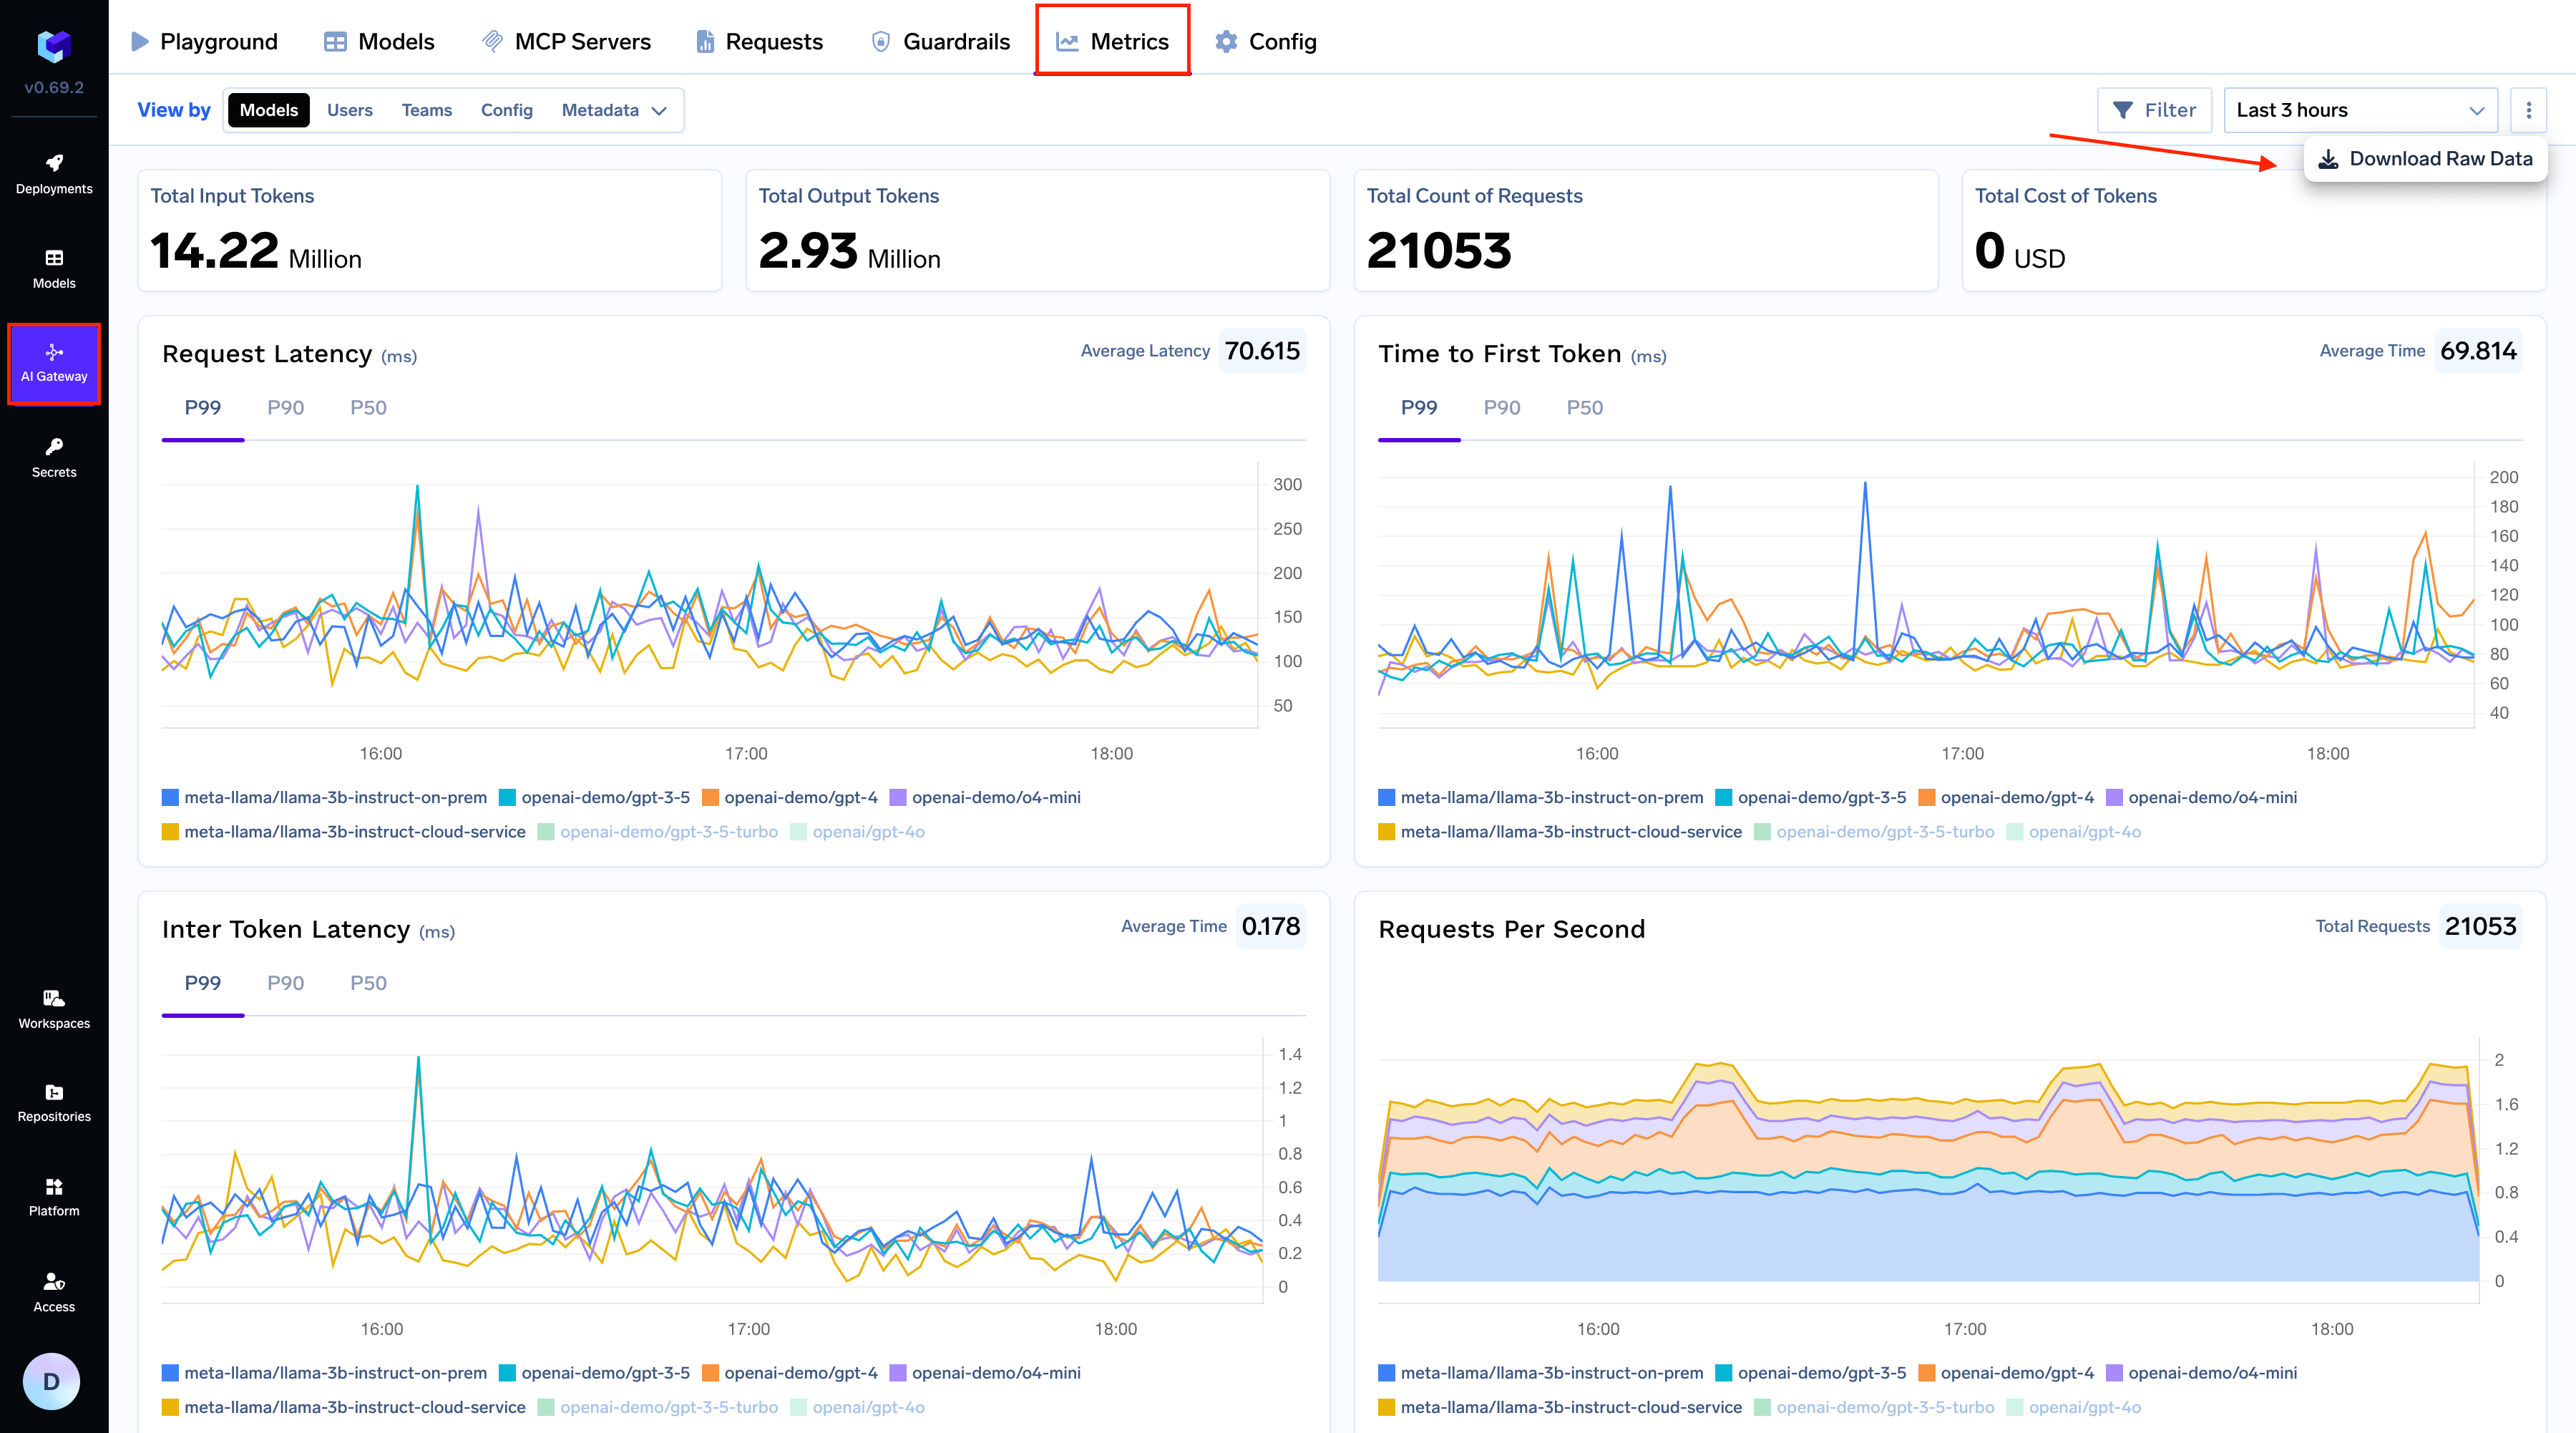
This view provides a model-centric overview of your application’s performance. All graphs and metrics are grouped by model_name, allowing you to directly compare how different models perform under real-world load.Use this view to:
Compare response times and streaming latency (TTFS & ITL) and pin point the models which are underperfoming or causing latency issues.
Monitor cost and token consumption to keep your budget in check.
Track requests per second and error rates to identify performance or reliability issues with specific models.
This view includes graphs for:
Request Latency: The total time taken to process a request.
Time to First Token (TTFS): The time elapsed until the first token of a response is received (for streaming responses).
Inter-Token Latency (ITL): The average time between consecutive tokens in a response (for streaming responses).
Cost Per Model: The total cost incurred by each model.
Input/Output Tokens: The number of tokens processed by each model.
Error Codes: A breakdown of errors by type for each model.
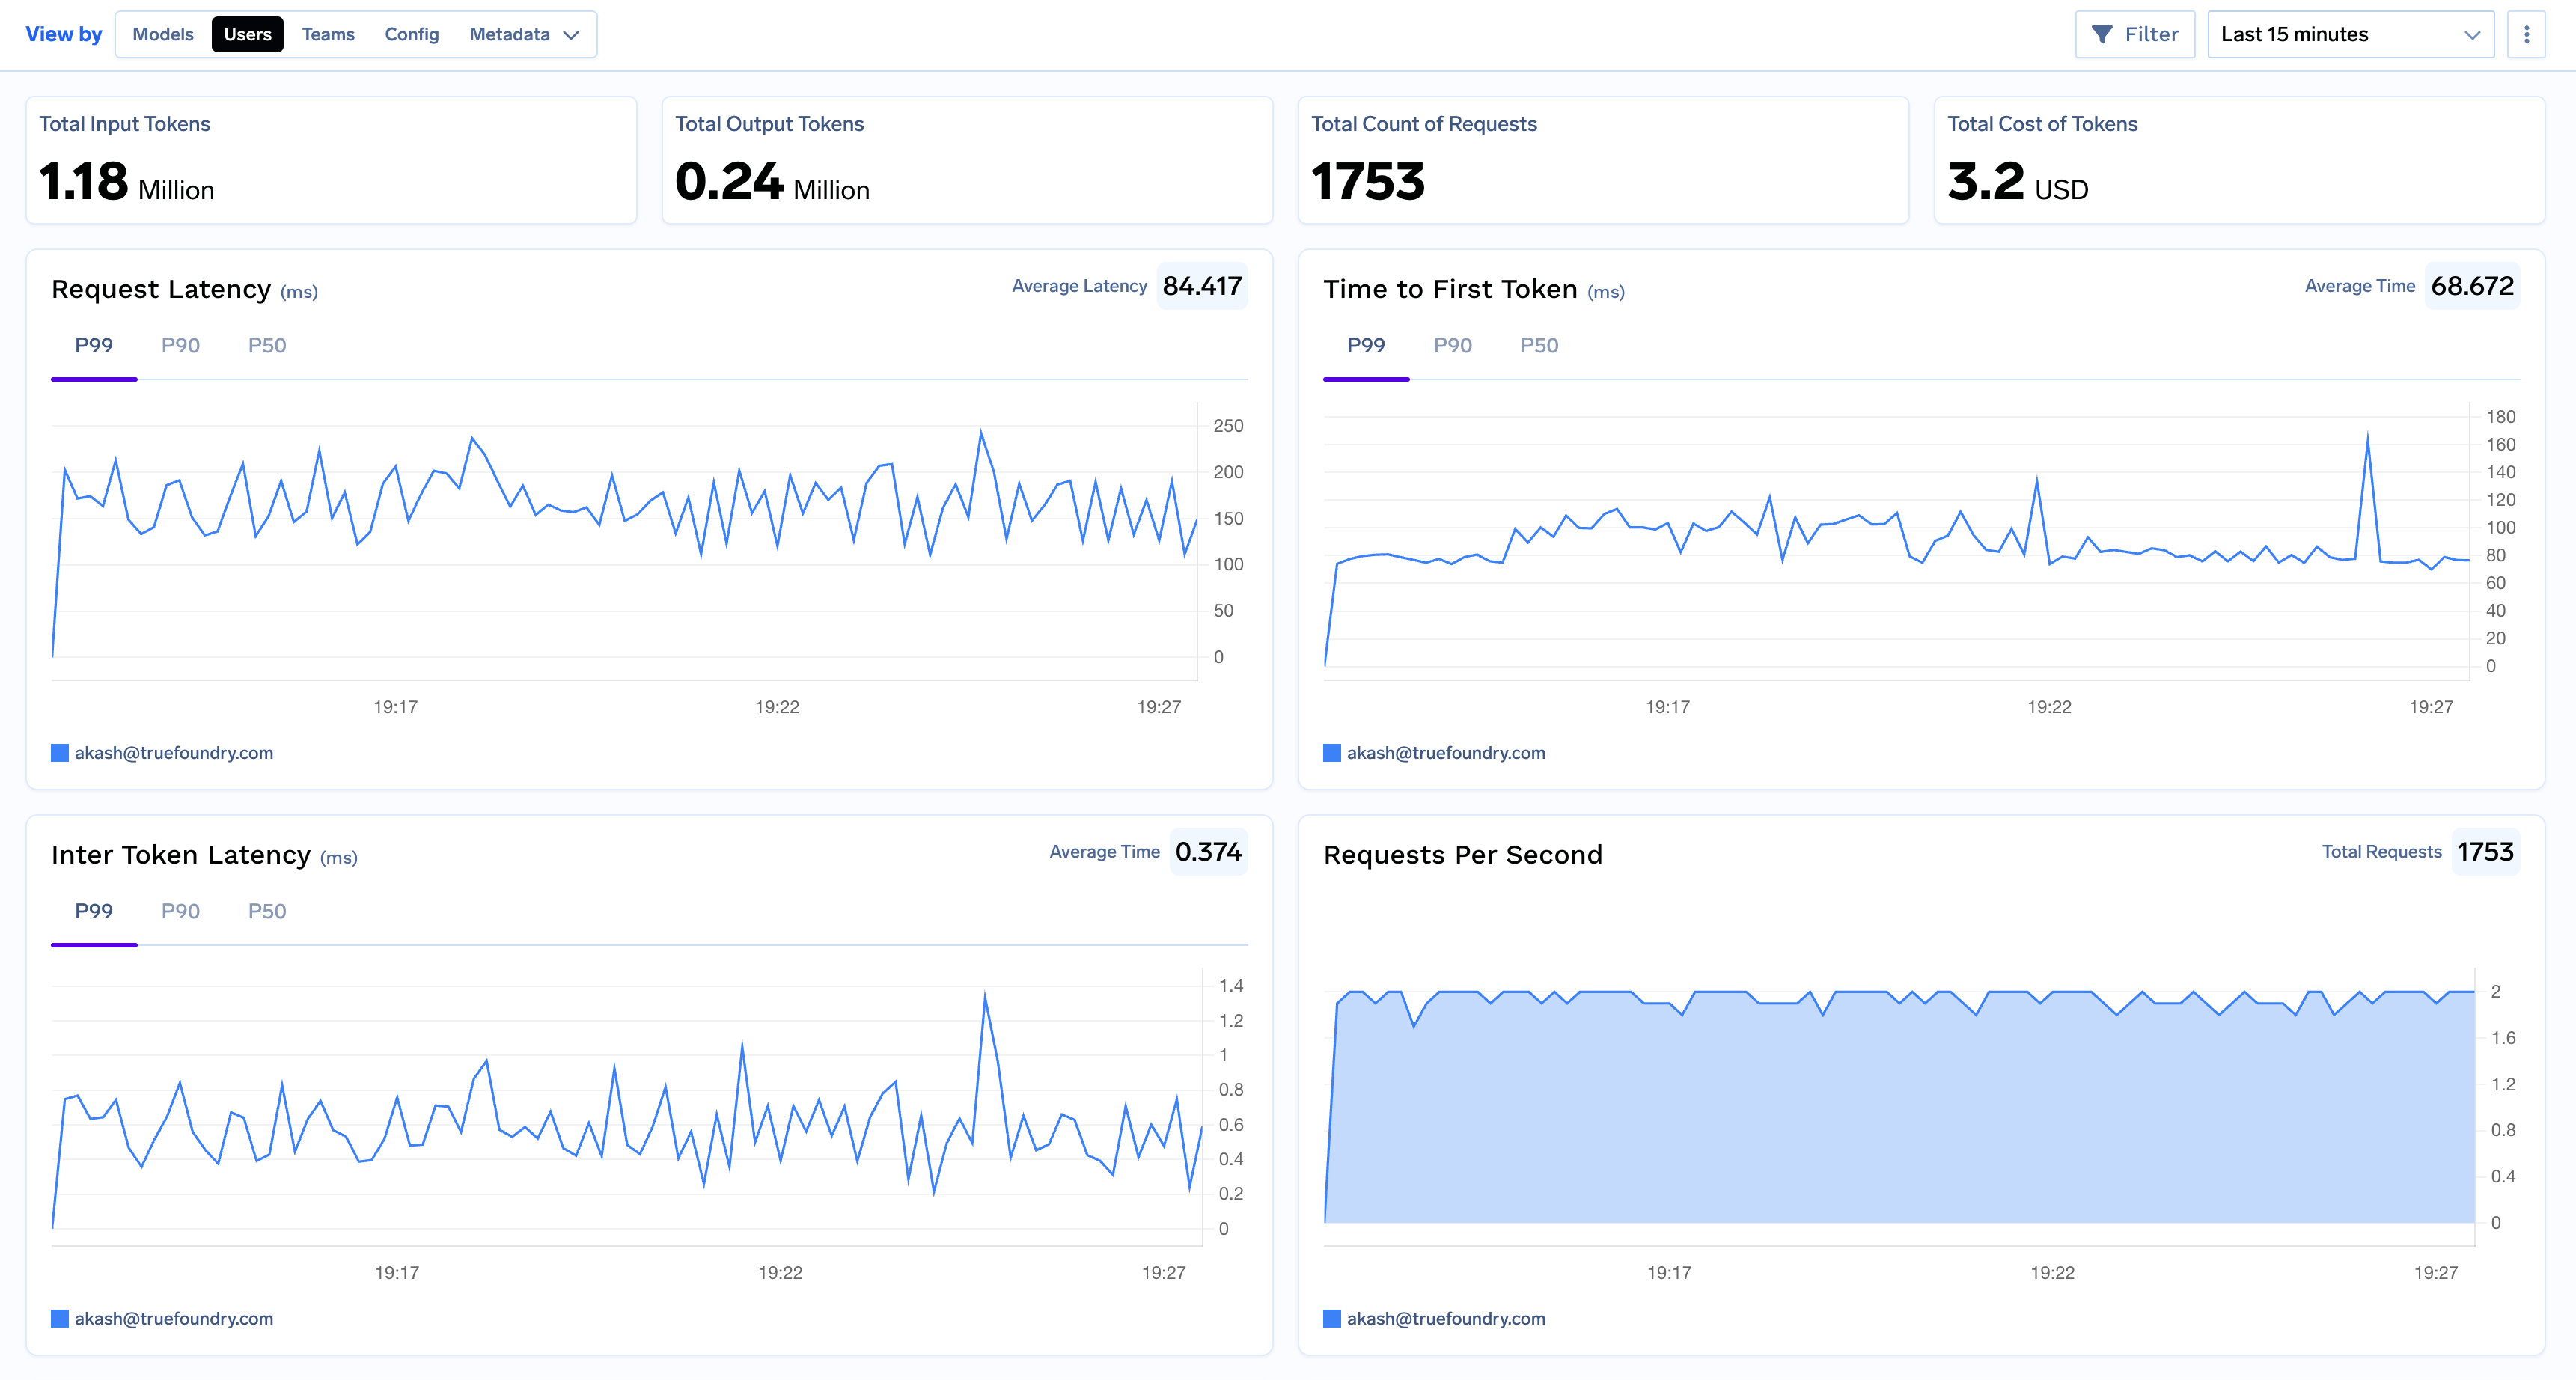
This view pivots the dashboard to show metrics based on who is making the requests, grouping all data by username. This is useful for understanding the usage patterns of individual applications or users.Use this view to:
Identify your most active users or applications.
Compare latency and token costs for different users.
Debug user-specific issues by filtering for their traffic.
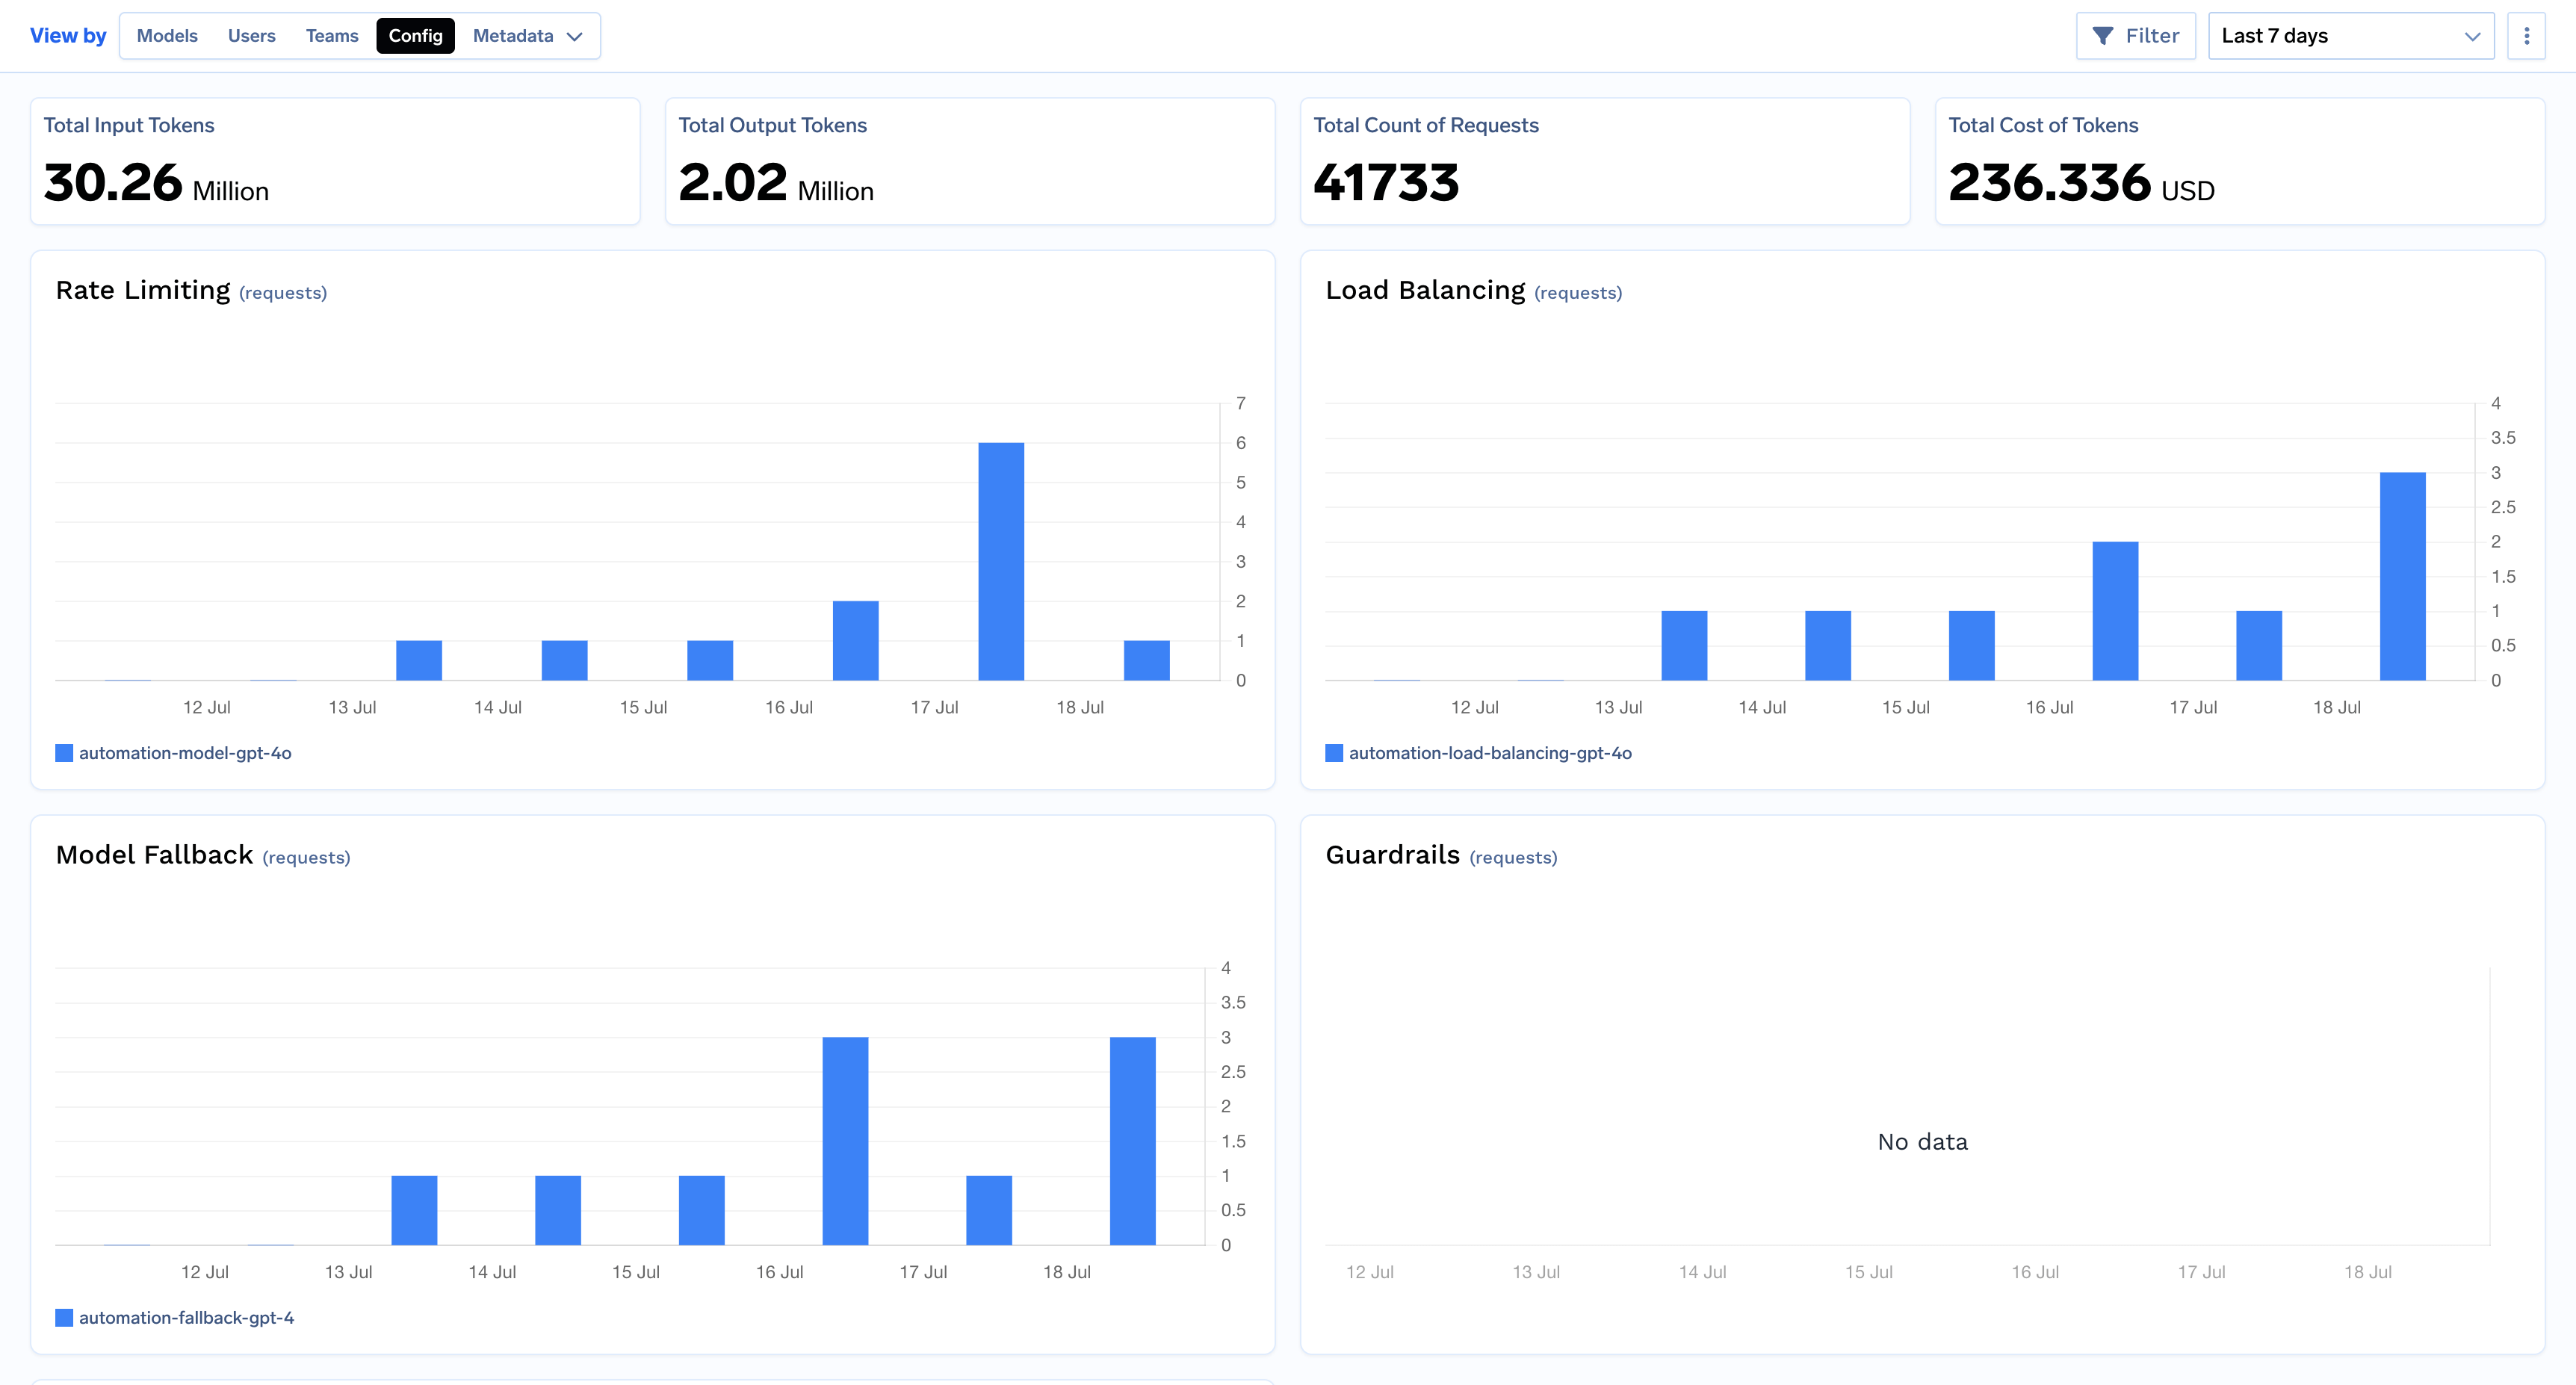
This view reveals how your gateway configurations are impacting your requests by grouping them by the ruleId that was triggered. It helps you see which policies are having the most impact.This view helps you understand the impact of:
Rate Limiting: How often requests are being throttled.
Load Balancing: How traffic is being distributed across different models or deployments.
Fallbacks: When and why fallback models are being used.
Guardrails: How often content policies are being enforced.
Budget Configs: When budget limits are being reached.
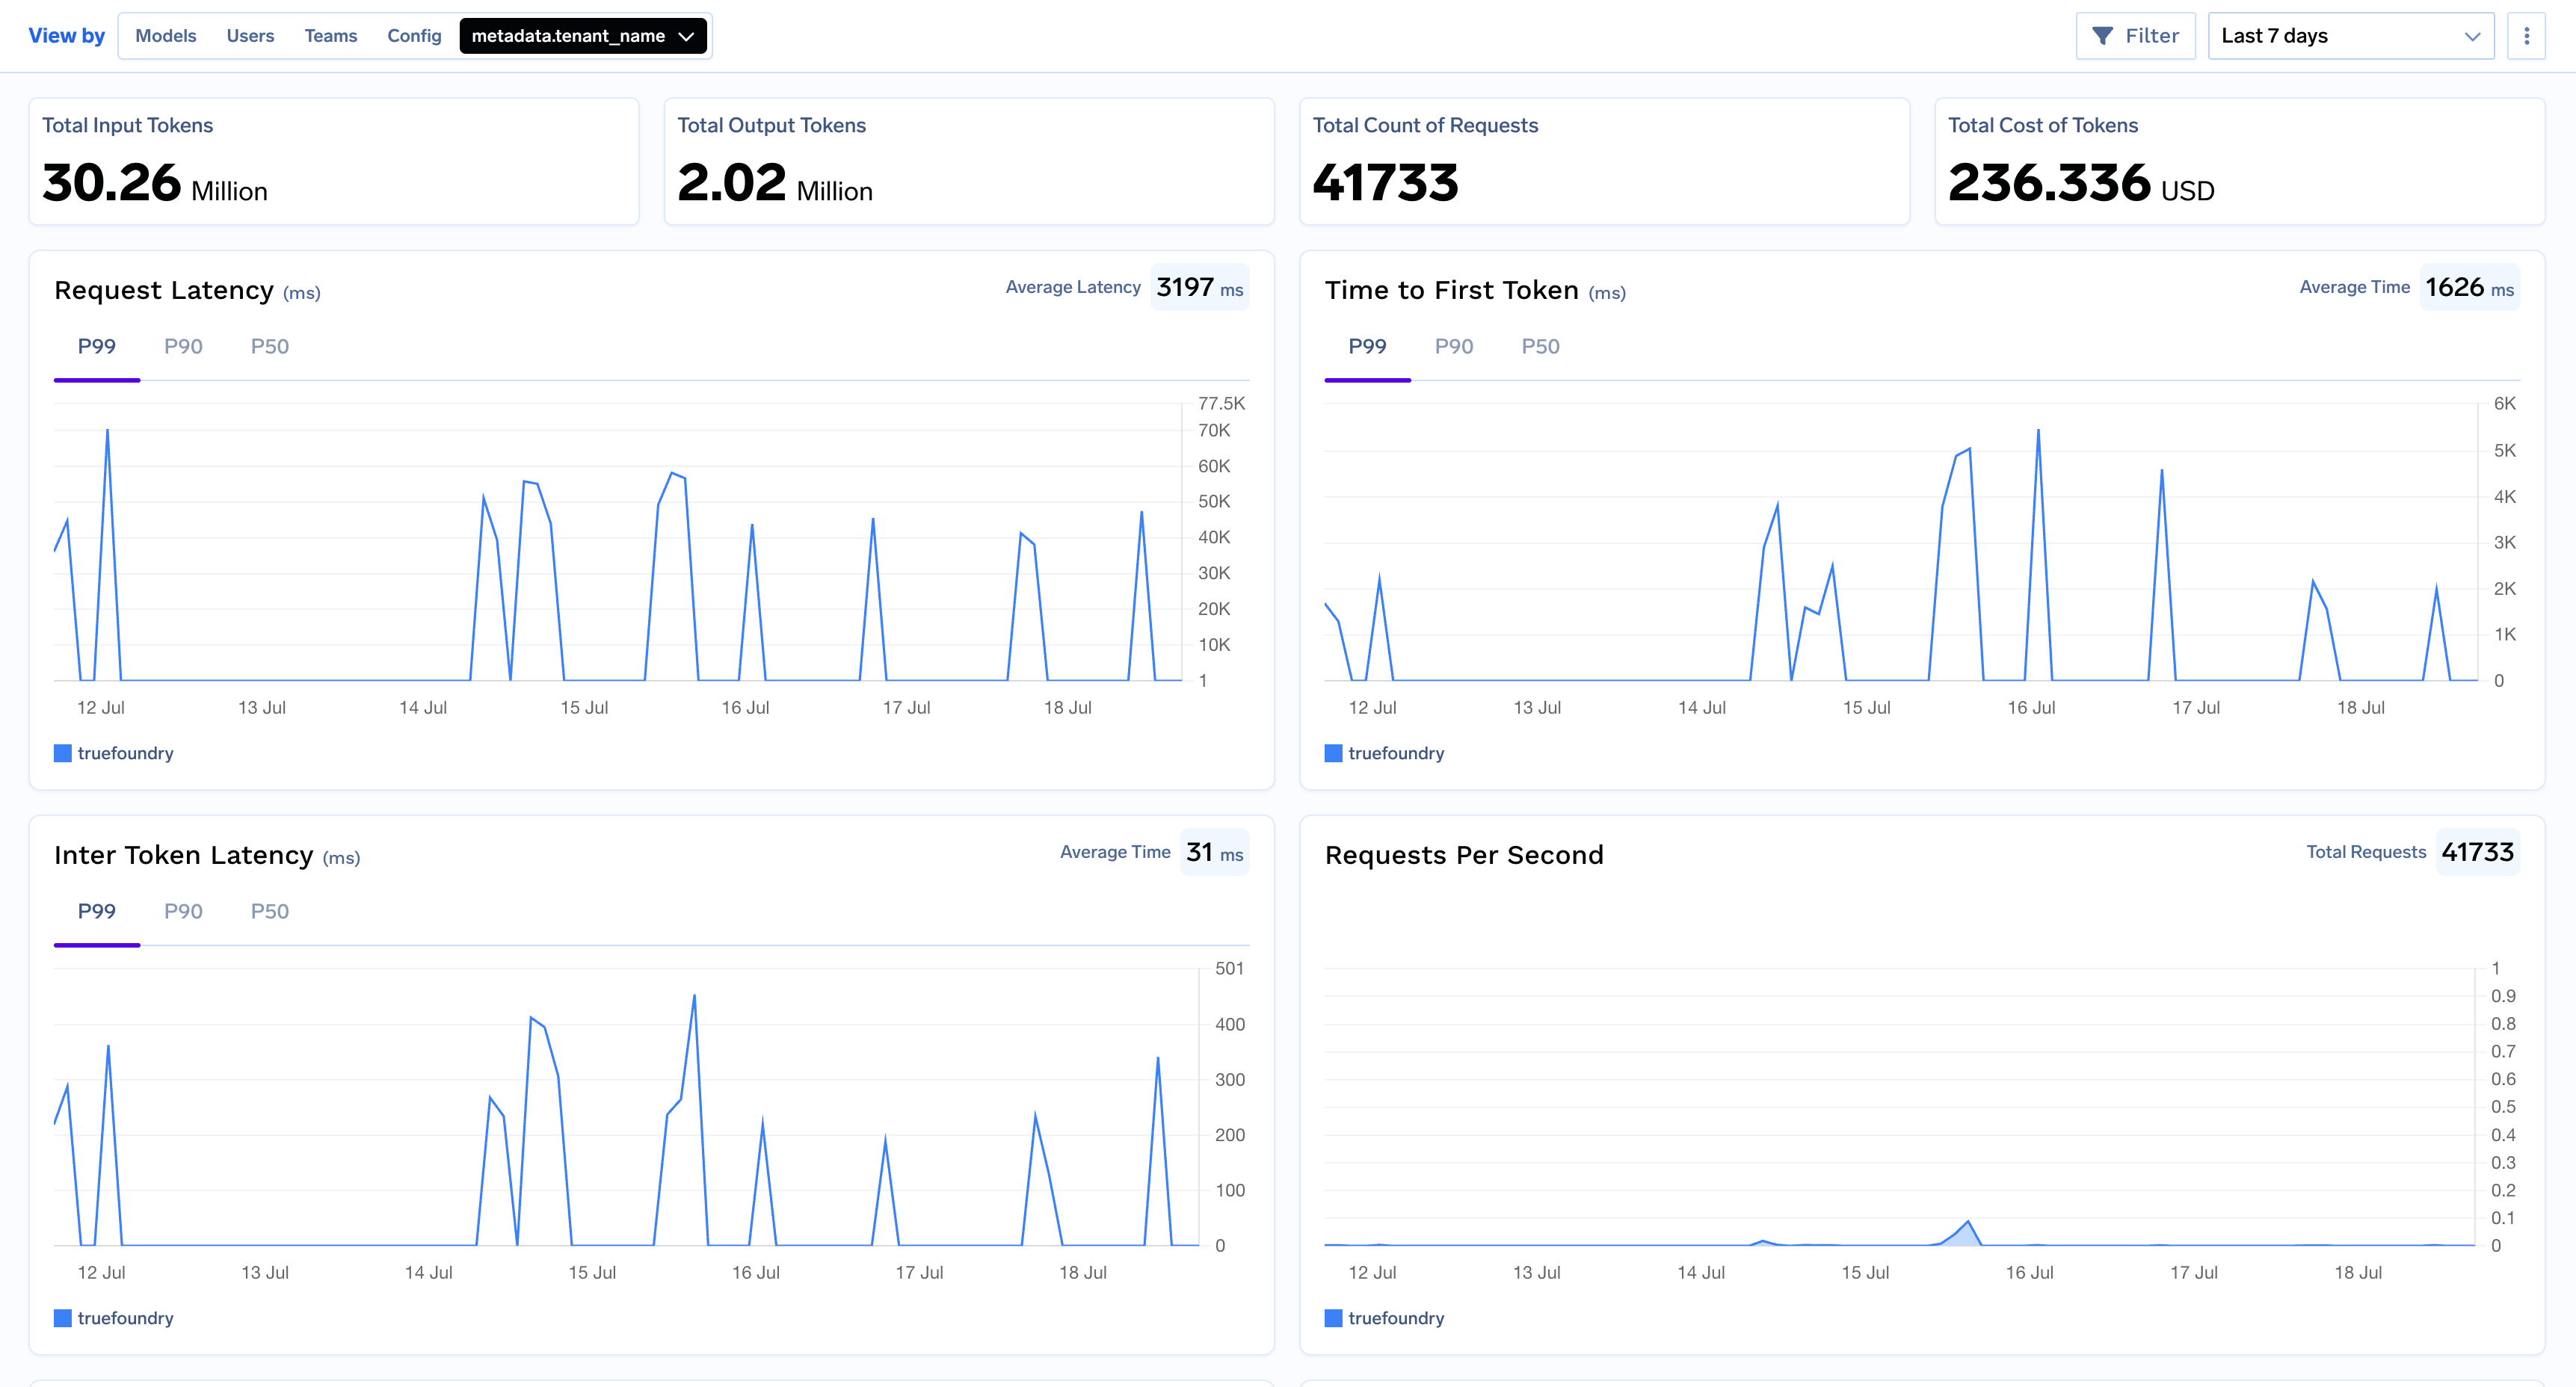
For more specific analysis, the Metrics Dashboard allows you to group data by custom metadata keys sent in the request headers. For example, you can group by a tenant_name to analyze metrics for each of your customers.
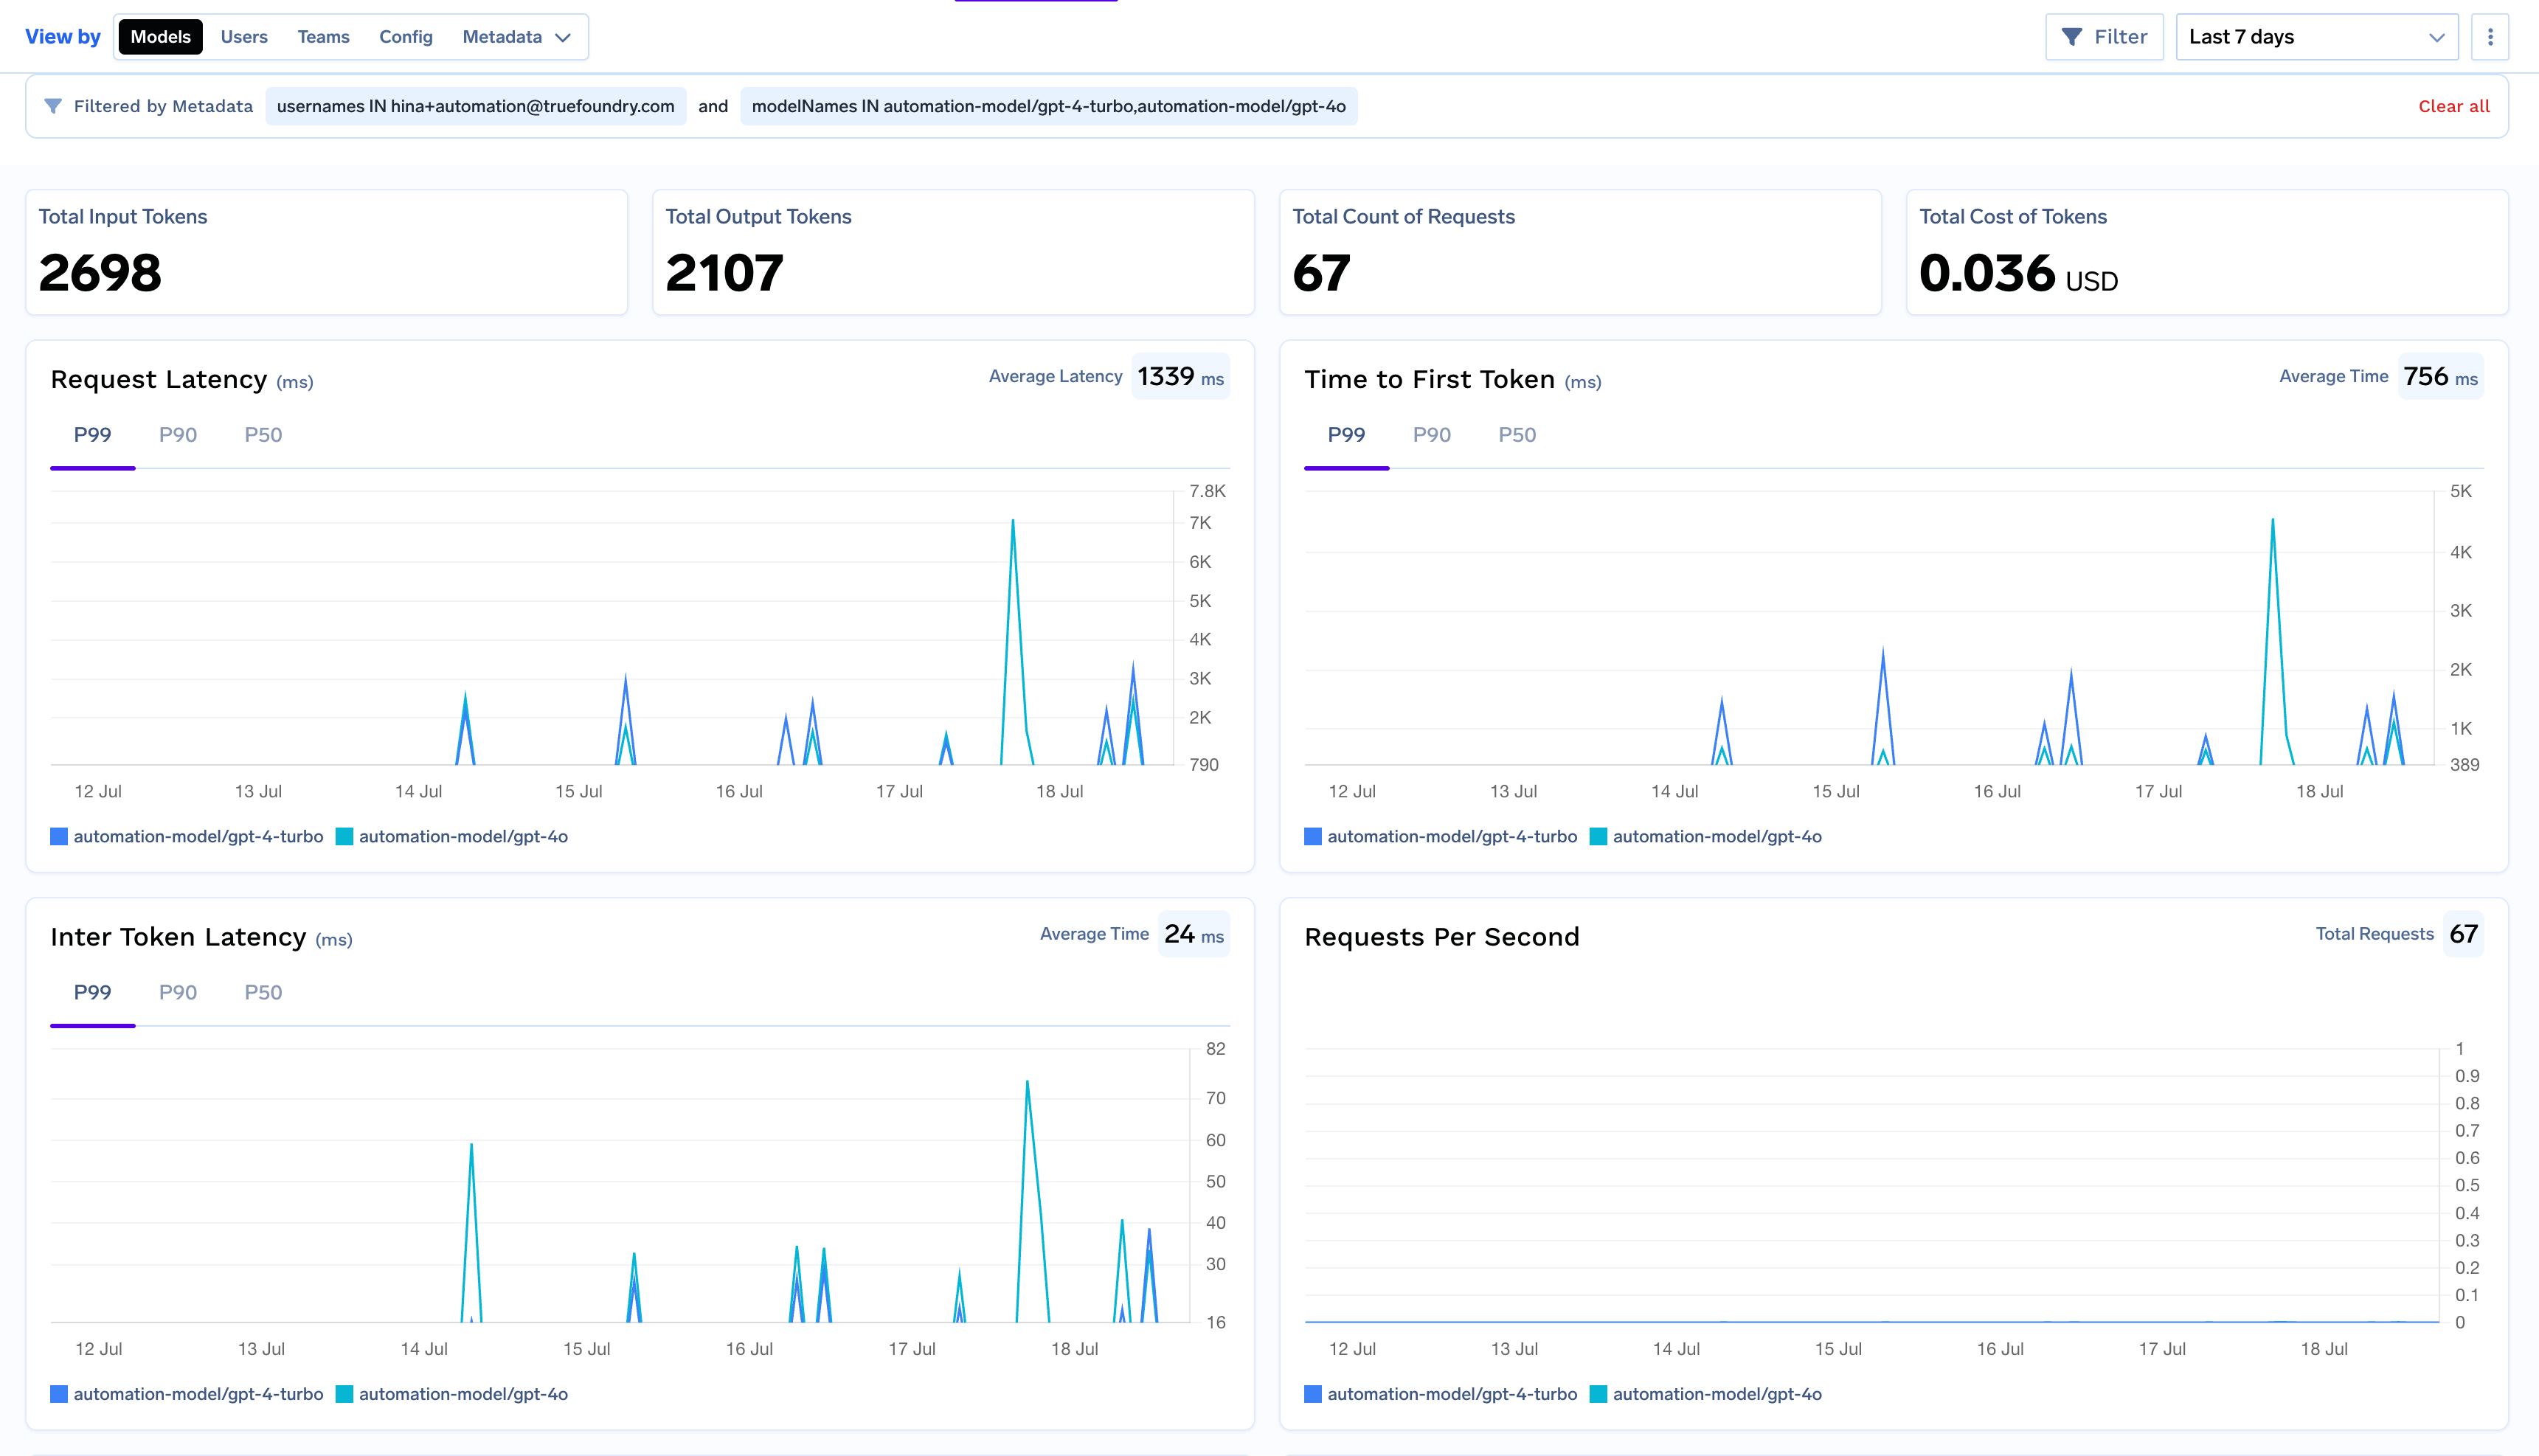
The dashboard also includes filters that allow you to narrow down your analysis to specific models, users, teams, or custom metadata fields. This makes it easier to investigate specific patterns or issues.
In addition to viewing metrics in the dashboard, you can also download the complete raw data in CSV format. This is useful for offline analysis, creating custom visualizations, or integrating with other data analysis tools.