This guide demonstrates how to use TrueFoundry OtelCollector along with the Traceloop SDK to instrument FastAPI applications.
In this example, we’ll create a simple FastAPI application with a /greet
endpoint that demonstrates how to integrate TrueFoundry’s tracing capabilities.
Create Tracing Project, API Key and copy tracing code
Follow the instructions in Getting Started to create a tracing project, generate API key and copy the
tracing code.
Install Dependencies
First, you need to install the following
pip install fastapi uvicorn dotenv opentelemetry-instrumentation-fastapi==0.55b0 traceloop-sdk
Add Tracing code to FastAPI application
For FastAPI applications, we need to add the Traceloop.init()
call to the application and instrument the FastAPI app with OpenTelemetry.
from dotenv import load_dotenv
from fastapi import FastAPI
from opentelemetry.instrumentation.fastapi import FastAPIInstrumentor
import uvicorn
import os
# importing traceloop sdk
from traceloop.sdk import Traceloop
load_dotenv()
# Add the traceloop init code to your application
TFY_API_KEY = os.environ.get("TFY_API_KEY")
Traceloop.init(
api_endpoint="<enter_your_api_endpoint>",
headers = {
"Authorization": f"Bearer {TFY_API_KEY}",
"TFY-Tracing-Project": "<enter_your_tracing_project_fqn>",
},
)
app = FastAPI()
def get_random_greeting():
greetings = ["Hello", "Hi", "Hey", "Good morning", "Good afternoon", "Good evening"]
return random.choice(greetings)
@app.get("/generate-greeting")
async def root():
greeting = get_random_greeting()
return {"message": f"{greeting}, wishing you a great day!"}
# Instrument the FastAPI app
FastAPIInstrumentor.instrument_app(app)
if __name__ == "__main__":
uvicorn.run("main:app", host="0.0.0.0", port=8000, reload=True, log_level="debug")
Run your application and view logged trace
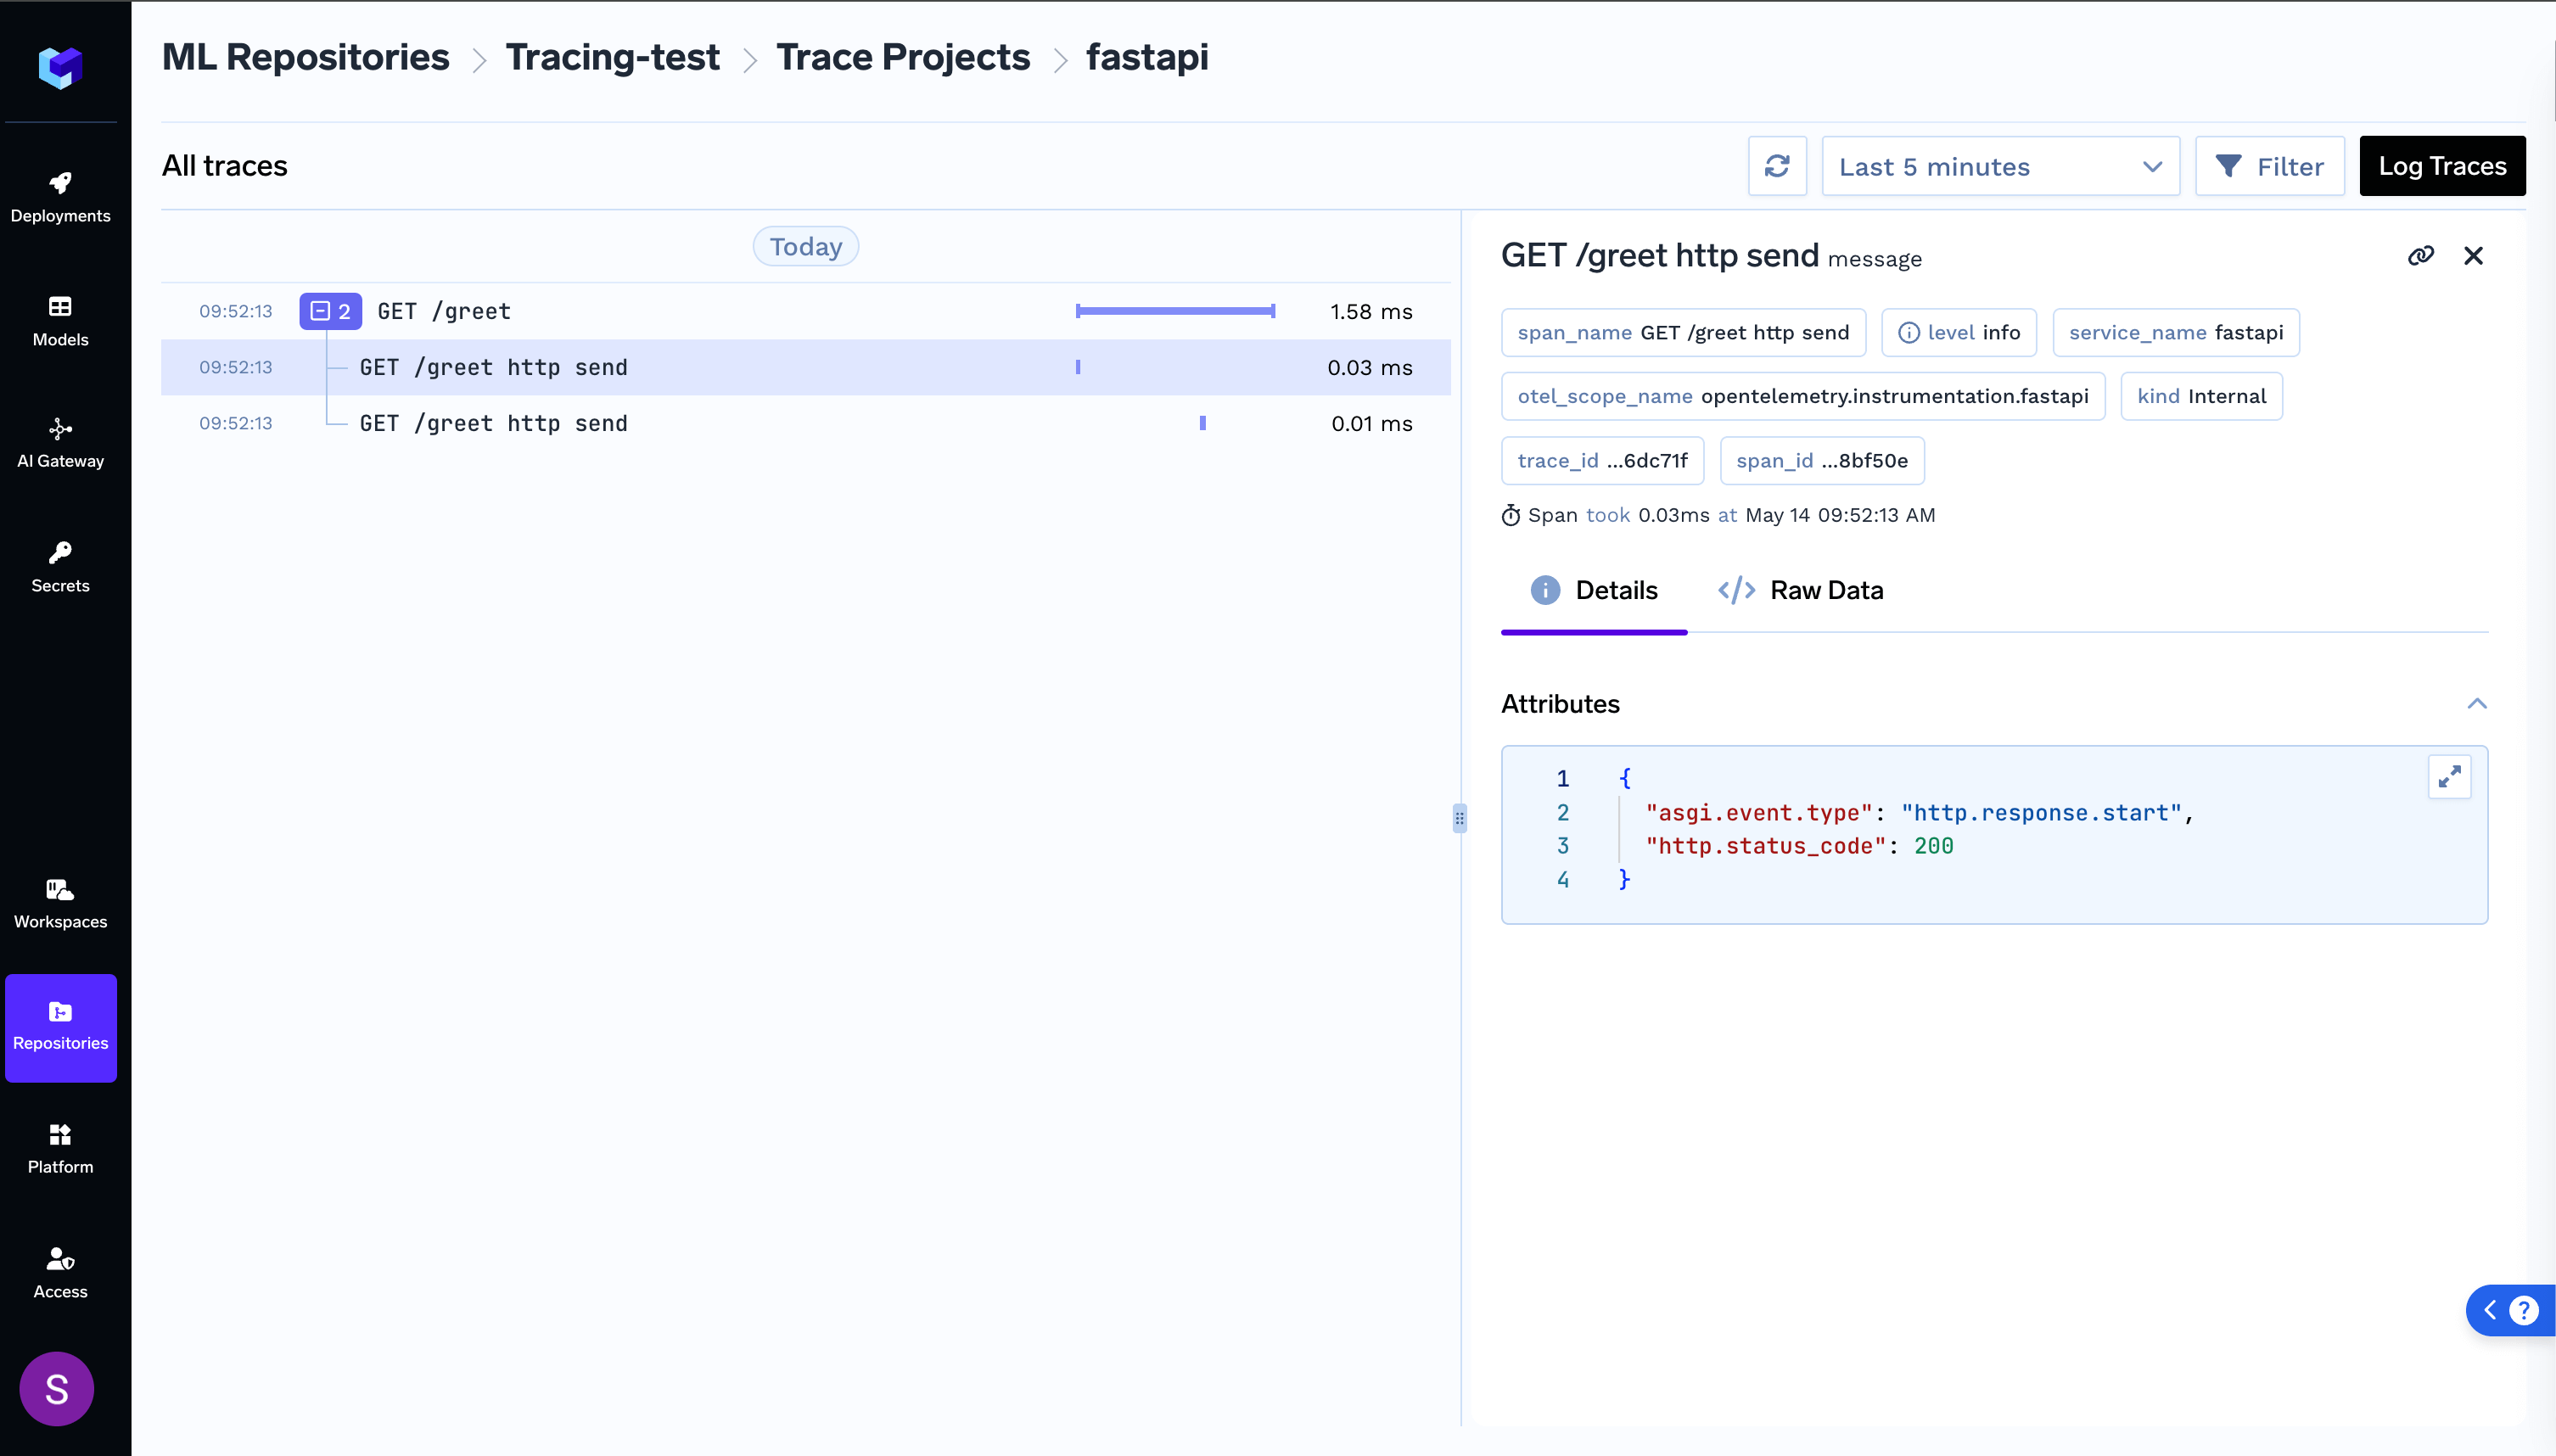
Trace custom internal functions
OpenTelemetry’s FastAPI instrumentation automatically handles tracing for incoming HTTP requests to your ASGI app. It creates and completes spans for the request/response lifecycle without any additional setup.
However, it does not automatically trace other parts of your application, such as internal function calls, outgoing HTTP requests to other services, background tasks or database queries.
To trace such operations, you can use OpenTelemetry’s existing instrumentation libraries . For example, if your app makes HTTP requests using httpx
, you can use the opentelemetry-instrumentation-httpx
package. The same GitHub repository provides instrumentation libraries for many popular Python frameworks and libraries.
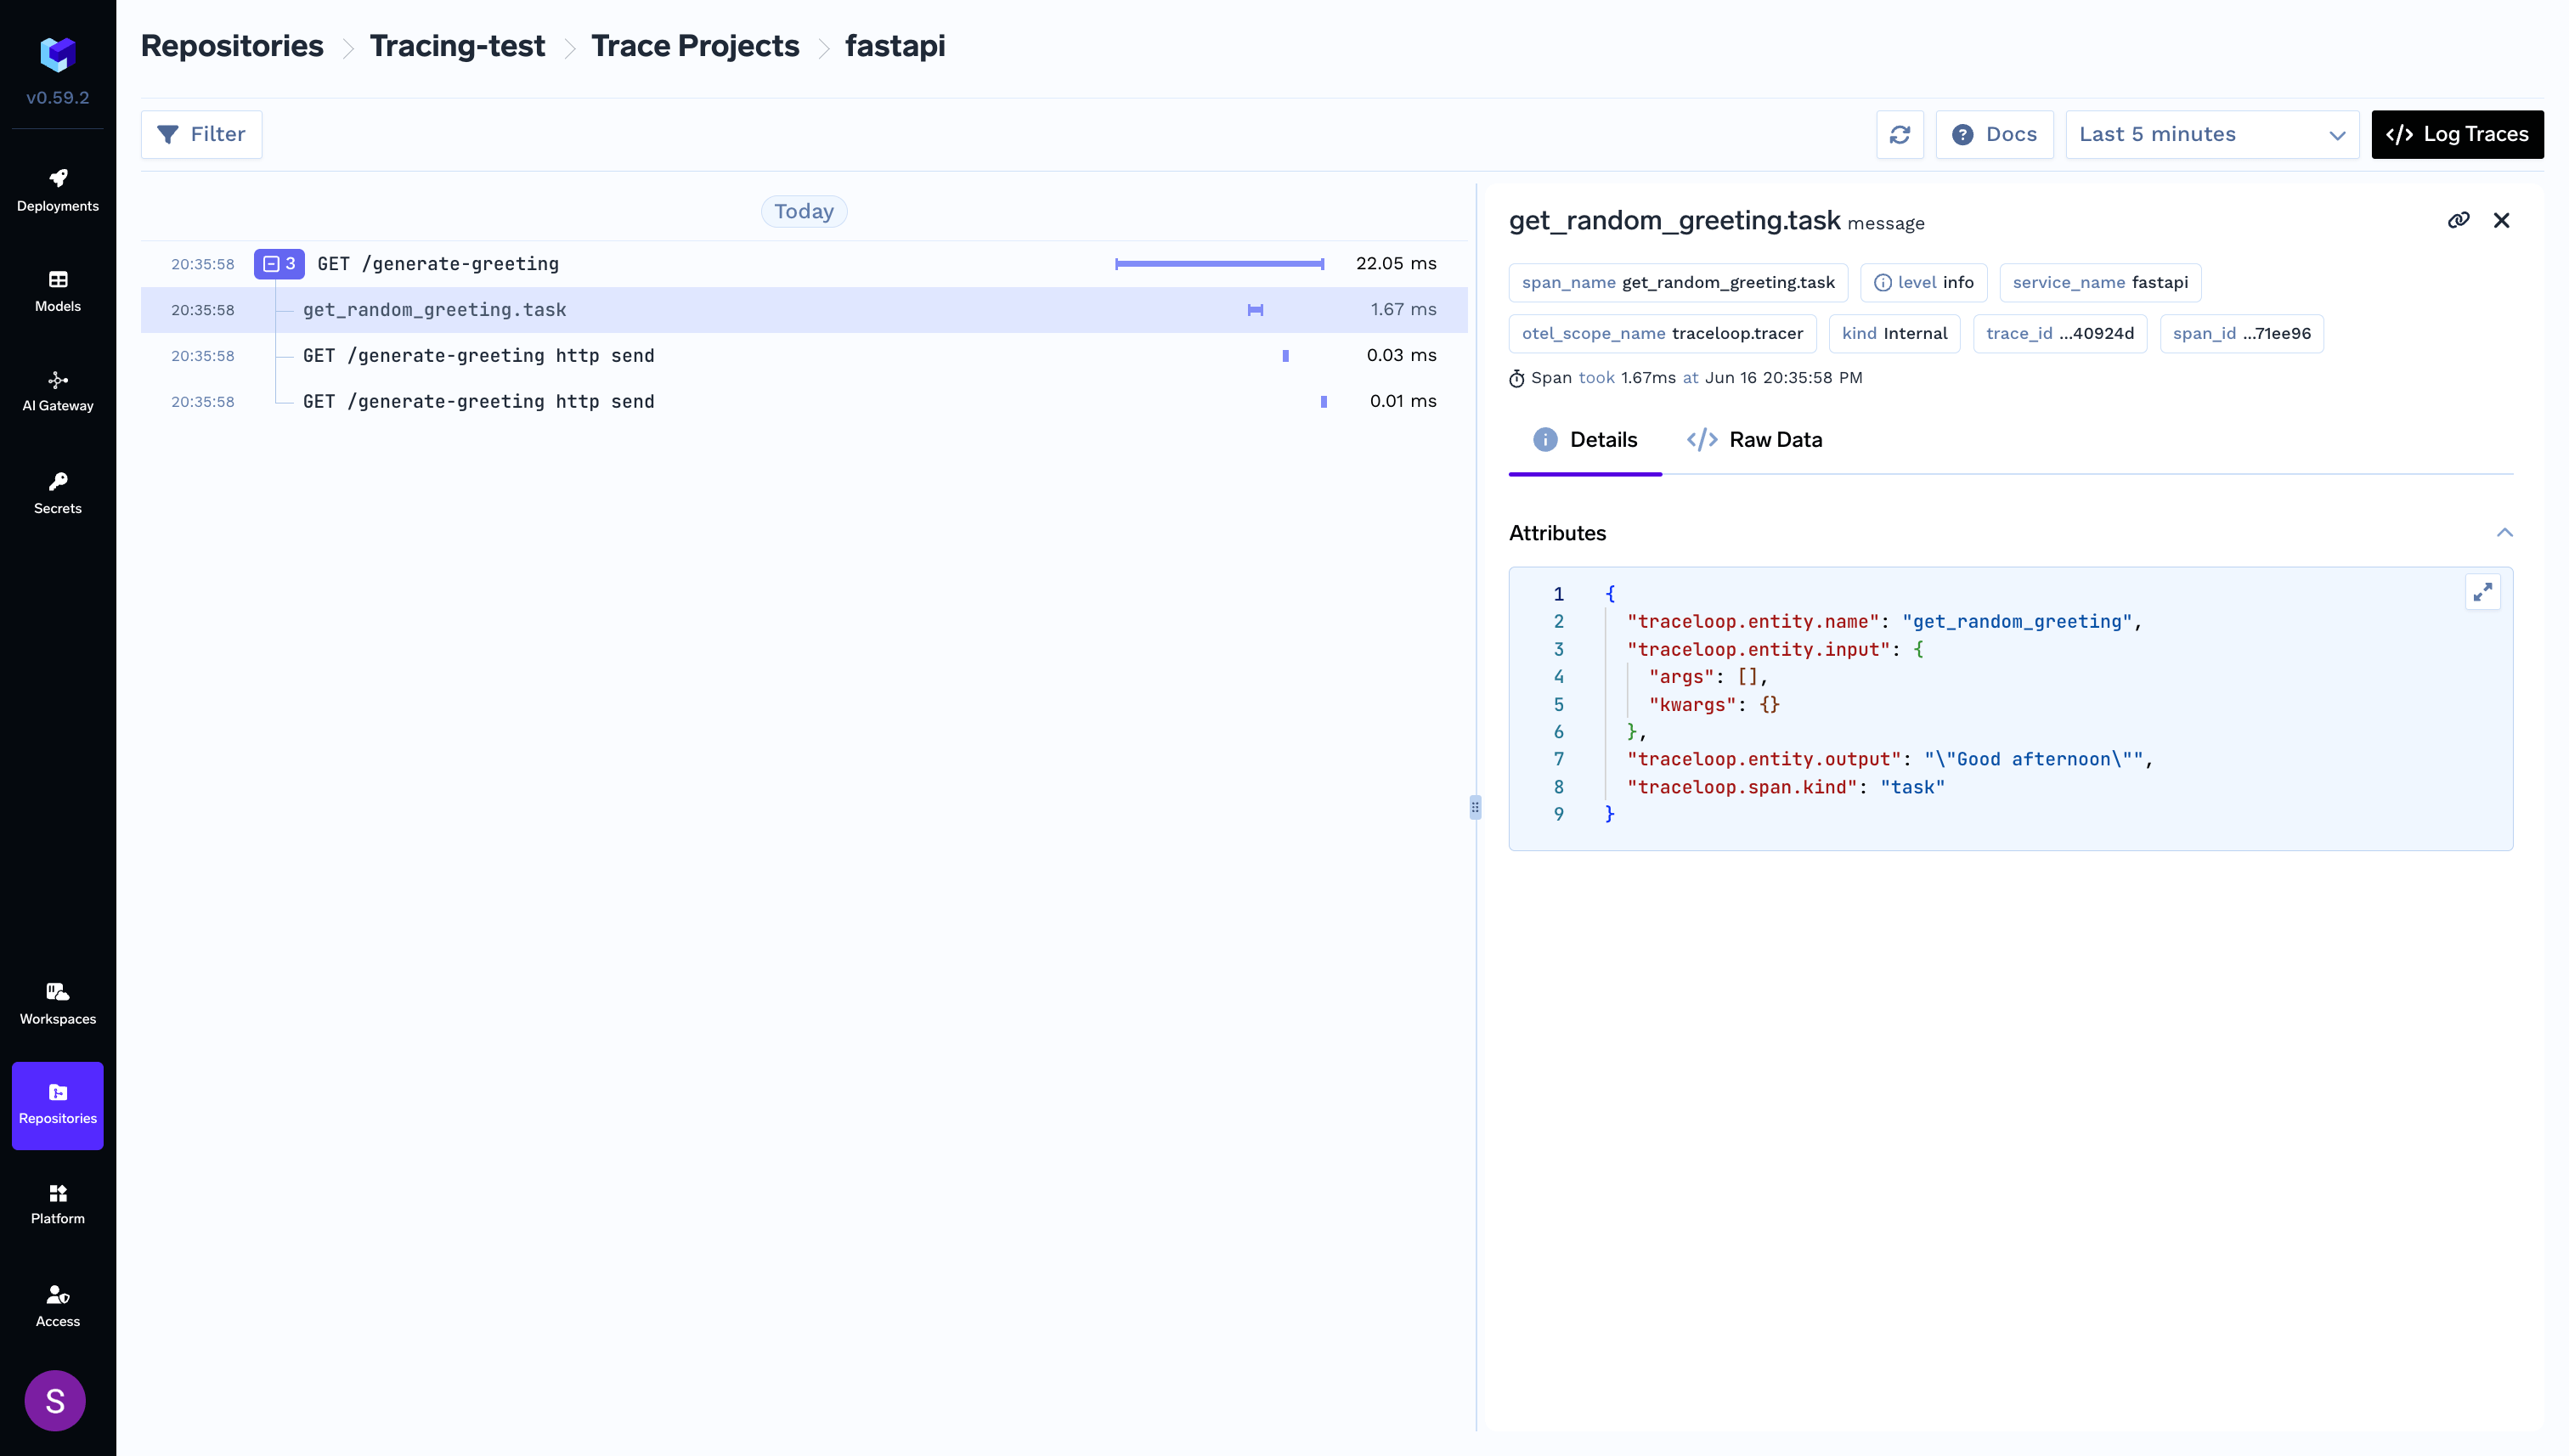
For a broader overview of how to integrate these libraries into your app, refer to our Distributed Tracing guide, which also includes examples with httpx
instrumentation.
If you’re working with custom internal logic that isn’t covered by existing instrumentation, you can use Traceloop’s decorators to manually trace specific functions.
Here’s an example of adding tracing to an internal function using the @task
decorator:
from dotenv import load_dotenv
from fastapi import FastAPI
from opentelemetry.instrumentation.fastapi import FastAPIInstrumentor
import uvicorn
import os
import random
# importing traceloop sdk
from traceloop.sdk import Traceloop
from traceloop.sdk.decorators import task
load_dotenv()
# Add the traceloop init code to your application
TFY_API_KEY = os.environ.get("TFY_API_KEY")
Traceloop.init(
api_endpoint="https://internal.devtest.truefoundry.tech/api/otel",
headers = {
"Authorization": f"Bearer {TFY_API_KEY}",
"TFY-Tracing-Project": "tracing-project:truefoundry/Tracing-test/fastapi",
},
)
app = FastAPI()
@task(name="get_random_greeting")
def get_random_greeting():
greetings = ["Hello", "Hi", "Hey", "Good morning", "Good afternoon", "Good evening"]
return random.choice(greetings)
@app.get("/generate-greeting")
async def root():
greeting = get_random_greeting()
return {"message": f"{greeting}, wishing you a great day!"}
# Instrument the FastAPI app
FastAPIInstrumentor.instrument_app(app)
if __name__ == "__main__":
uvicorn.run("main:app", host="0.0.0.0", port=8000, reload=True, log_level="debug")
Run your application and view traces, including custom function spans