Key Concepts
Trace A trace would represent the complete lifecycle of a request or task as it flows through the various services and components that interact with the LLM. This could involve multiple stages, such as receiving input from the user, sending the input to the model for inference, processing the model’s output, and delivering the result back to the user. SpanA span represents an individual unit of work or operation that occurs within the trace. It could be a function call, an HTTP request, a database query, or any other significant unit of work. In the context of an LLM application, spans are used to capture each distinct task or action that is performed during the lifecycle of a request.
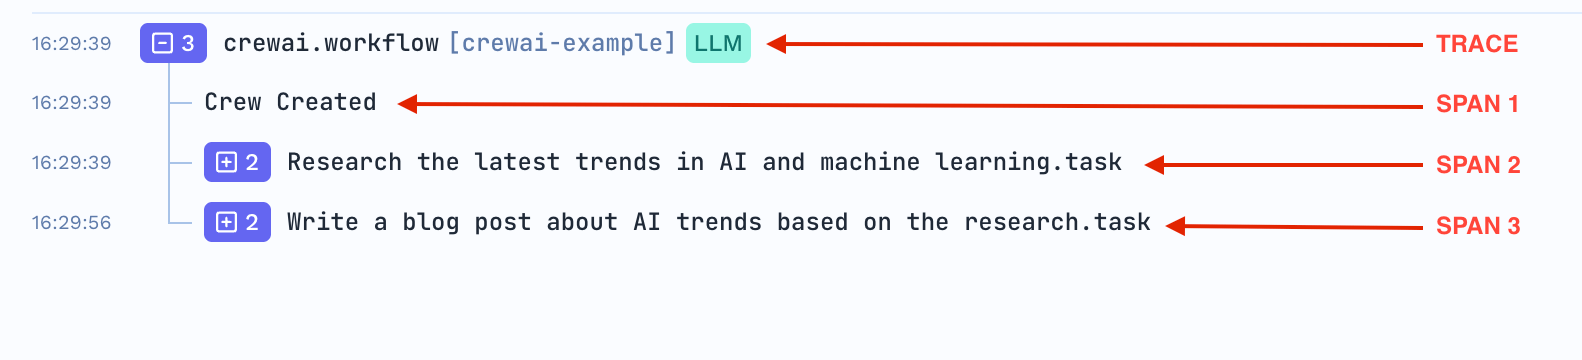
A trace a tree-like structure of spans, where each span represents a unit of work within the transaction. Spans can have parent-child relationships, forming a hierarchical structure within the trace. A child span is usually caused by its parent span.
Imagine a user queries an LLM for a recommendation. The trace would look something like this:
-
Trace: Tracks the entire user request from input to response.
- Span 1: Input preprocessing (parsing and tokenizing the user query).
- Span 2: Model inference (running the LLM to generate a recommendation).
- Span 3: Post-processing (formatting the recommendation output).
- Span 4: Output delivery (returning the recommendation to the user).
TrueFoundry’s Tracing UI
How does TrueFoundry’s Tracing work?
Truefoundry’s provides a OpenTelemetry collector backend that can store opentelemetry-based traces and comes with a user-friendly UI to query and analyze traces. It can receive traces from any opentelemetry compatible SDK - however, for LLM usecases we strongly recommend using the Traceloop SDK as it’s built to capture LLM specific traces and metrics and comes with a lot of inbuilt integrations. You can also use the standardopentelemetry-sdk to instrument your application and send traces - however, that will require a lot of coding and instrumentation on your part.
The list of providers and frameworks supportedby Traceloop is available here. Here’s a quick summary of the list:
Models
| Model SDK | Python | Typescript |
|---|---|---|
| Azure OpenAI | ✅ | ✅ |
| Aleph Alpha | ✅ | ❌ |
| Anthropic | ✅ | ✅ |
| Amazon Bedrock | ✅ | ✅ |
| Amazon SageMaker | ✅ | ❌ |
| Cohere | ✅ | ✅ |
| IBM watsonx | ✅ | ⏳ |
| Google Gemini | ✅ | ✅ |
| Google VertexAI | ✅ | ✅ |
| Groq | ✅ | ❌ |
| Mistral AI | ✅ | ❌ |
| OpenAI | ✅ | ✅ |
| Replicate | ✅ | ❌ |
| together.ai | ✅ | ❌ |
| HuggingFace Transformers | ✅ | ❌ |
Vector DBs
| Vector DB | Python | Typescript |
|---|---|---|
| Chroma DB | ✅ | ✅ |
| Elasticsearch | ✅ | ✅ |
| LanceDB | ✅ | ❌ |
| Marqo | ✅ | ❌ |
| Milvus | ✅ | ❌ |
| pgvector | ✅ | ✅ |
| Pinecone | ✅ | ✅ |
| Qdrant | ✅ | ✅ |
| Weaviate | ✅ | ❌ |
Frameworks
| Framework | Python | Typescript |
|---|---|---|
| Burr | ✅ | ❌ |
| CrewAI | ✅ | ❌ |
| Haystack by deepset | ✅ | ❌ |
| Langchain | ✅ | ✅ |
| LlamaIndex | ✅ | ✅ |