This section is applicable only if you are self-hosting the control-plane. In case Truefoundry is hosting the control-plane, everything is managed by Truefoundry and you don’t need to setup anything here.
truefoundry helm chart comes with basic monitoring. We expose critical metrics using prometheus’s ServiceMonitors and PodMonitors and we also expose a Grafana dashboard to visualize all of this easliy.
To access the Grafana dashboard you can either install Grafana installation managed by TrueFoundry or import the dashboard into your exisitng Grafana.
- To install new Grafana instance managed by TrueFoundry, navigate to
Platform > Clusters, click on the control plane cluster and install Grafana from the Add-Ons tab.
- To import the dashboard to exisitng Grafana - please find the dashboard.json here.
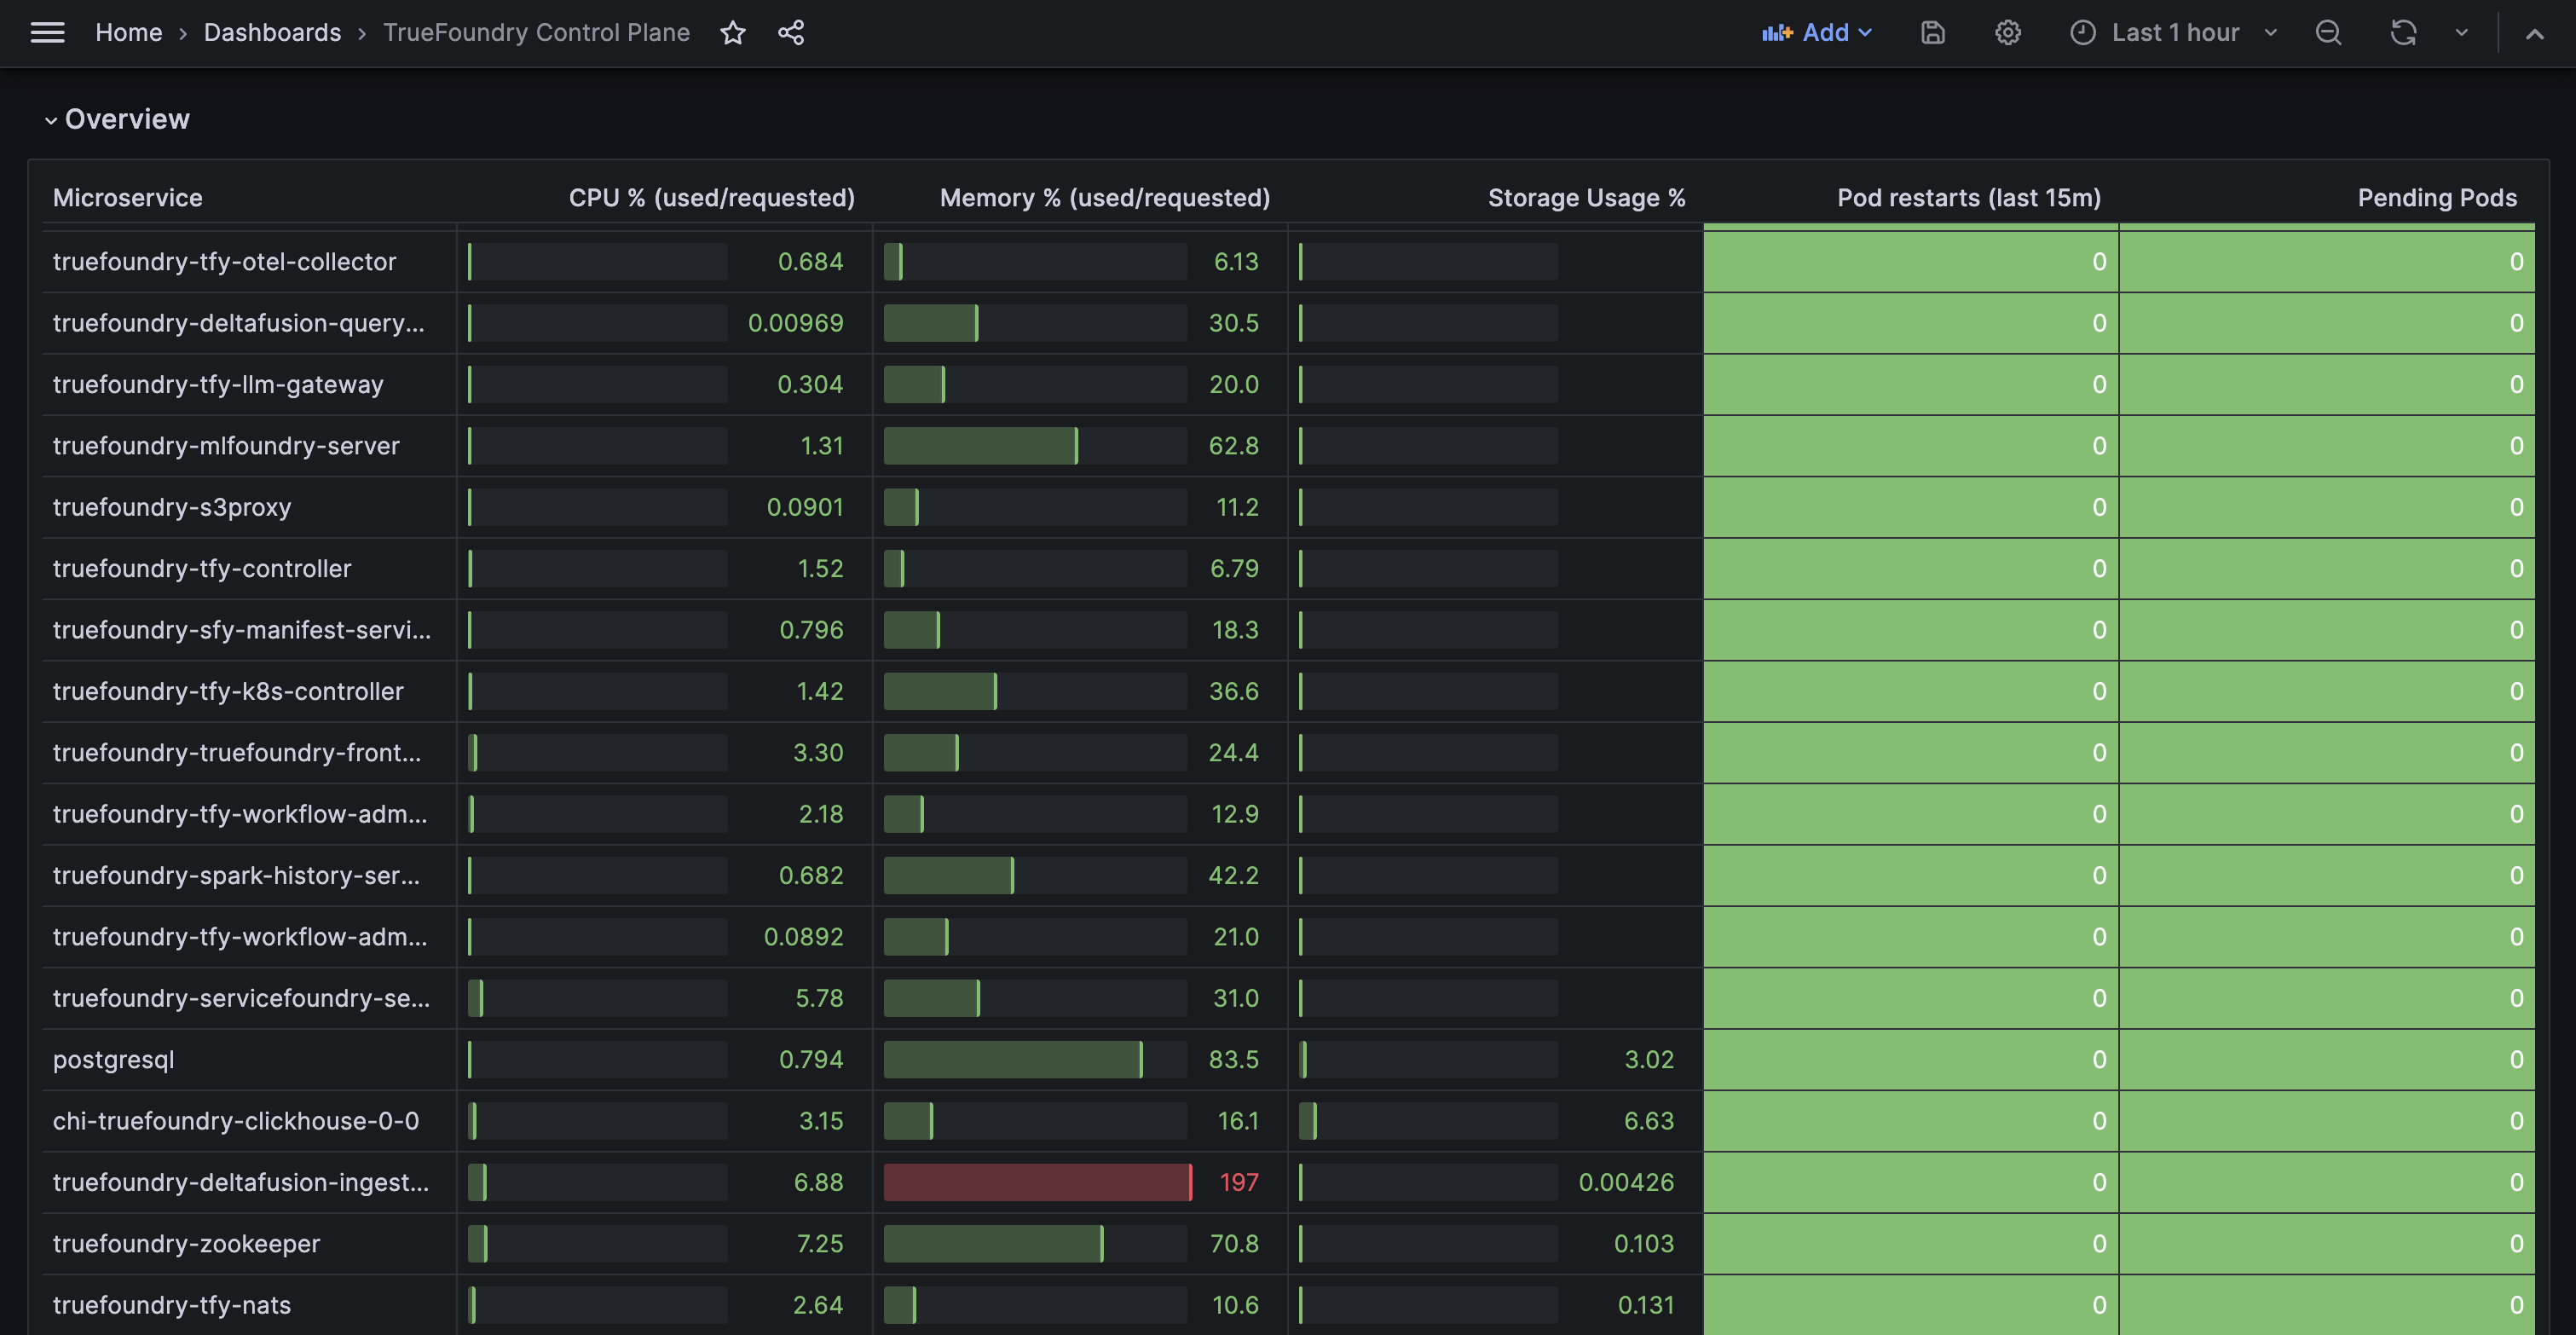
Dashboard can be accessed at Dashboards > General > TrueFoundry Control Plane as shown below:
Alerting
In most cases when you install the control-plane, Truefoundry sets up alerting to notify the Truefoundry team for any incident in your control-plane. You can add additional alert channels to also be notifies in case of any incident in your control-plane.
You can find the alerting configuration in the helm values file as follows:
monitoring:
  ## @param monitoring.enabled Bool to enable monitoring for the control plane
  enabled: false
  ## @param monitoring.tenantNameOverride Override tenant name for the monitoring
  tenantNameOverride: ""
  ## @param monitoring.commonLabels [object] Common labels for monitoring resources
  commonLabels: {}
  ## @param monitoring.commonAnnotations [object] Common annotations for monitoring resources
  commonAnnotations: {}
  ## monitoring.alertManager [object] Alert manager configuration
  alertManager:
    ## @param monitoring.alertManager.enabled Bool to enable alert manager
    enabled: true
    ## @param monitoring.alertManager.name Name of the alert manager configuration
    name: tfy-control-plane-alert-manager
    ## @param monitoring.alertManager.labels [object] Labels for alert manager
    labels: {}
    ## @param monitoring.alertManager.annotations [object] Annotations for alert manager
    annotations: {}
    slackConfigs:
      ## @param monitoring.alertManager.slackConfigs.enabled Bool to enable Slack notifications
      enabled: true
      ## @param monitoring.alertManager.slackConfigs.channel Slack channel to send alerts to
      channel: "#customer-cp-alerts"
      apiURL:
        ## @param monitoring.alertManager.slackConfigs.apiURL.name Name of secret containing Slack API URL
        name: tfy-control-plane-alert-manager-secret
        ## @param monitoring.alertManager.slackConfigs.apiURL.key Key in secret containing Slack API URL
        key: API_URL
      ## @param monitoring.alertManager.slackConfigs.additionalSlackConfigs Additional Slack configurations
      additionalSlackConfigs: []
    ## @param monitoring.alertManager.additionalReceivers Additional alert receivers
    additionalReceivers: []
    secret:
      ## @param monitoring.alertManager.secret.create Bool to create secret for alert manager
      create: false
      ## @param monitoring.alertManager.secret.name Name of the secret
      name: tfy-control-plane-alert-manager-secret
      ## @param monitoring.alertManager.secret.data [object] Data to be stored in secret
      data:
        API_URL: ""
  ## monitoring.alertRules [object] Alert rules configuration
  alertRules:
    ## @param monitoring.alertRules.enabled Bool to enable alert rules
    enabled: true
    ## @param monitoring.alertRules.name Name of the alert rules configuration
    name: tfy-control-plane-alert-rules
    ## @param monitoring.alertRules.labels [object] Labels for alert rules
    labels: {}
    ## @param monitoring.alertRules.annotations [object] Annotations for alert rules
    annotations: {}
monitoring.enabled to true and substituting the API_KEY provided by the Truefoundry team in the API_URL field. This will enable Truefoundry team to be paged for any incident in your control-plane.
If you want to remove the alerting to Truefoundry team, please set monitoring.alertManager.slackConfigs.enabled to false.
If you want to add your own Slack channel to be notified in case of any incident in your control-plane, please set monitoring.alertManager.slackConfigs.enabled to true and substitute the API_URL and channel with the Slack webhook URL and channel name of your channel.
If you want to setup multiple alert channels, for e.g. both to Truefoundry team and your own Slack channel, please set monitoring.alertManager.slackConfigs.enabled to true and add the additional receivers in the additionalReceivers field. You can read about all the supported alert receivers here: Alert Receivers.
monitoring:
  alertManager:
    additionalReceivers: []